
Switching to a new project management platform raises many questions. Oracle Primavera Cloud (OPC) is the cloud-based successor to the well-known Primavera P6 planning tool. More and more organizations that work with Primavera P6 are considering the switch to OPC because of the clear advantages in terms of costs, accessibility and collaboration. But what do you need to think about when you take this step? In this knowledge article, we discuss the most important points to consider for a smooth transition. We will discuss the benefits of OPC, essential OPC modules to get started with, how quickly teams can get started with OPC, how to get the team on board, and transferring current projects to the new environment.
Choosing Oracle Primavera Cloud offers various advantages over traditional on-premise solutions such as Primavera P6. Some important advantages at a glance:
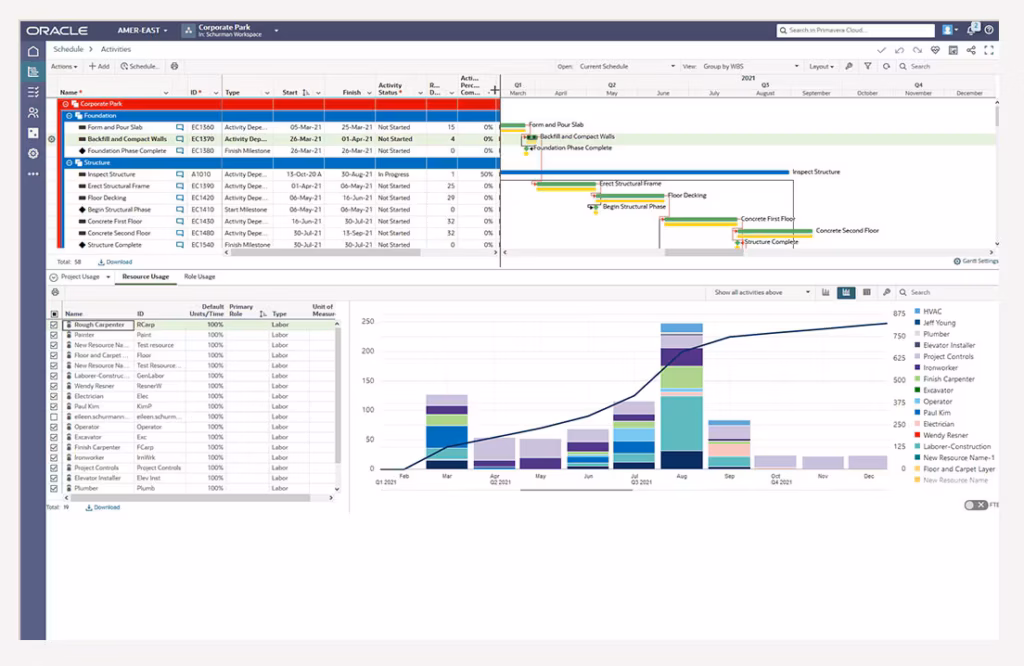
Oracle Primavera Cloud is an extensive suite with various modules (such as planning, risk management, resource & cost management, portfolio management and Lean planning). To get off to a solid start, it is wise to focus on the basics: planning and project management.
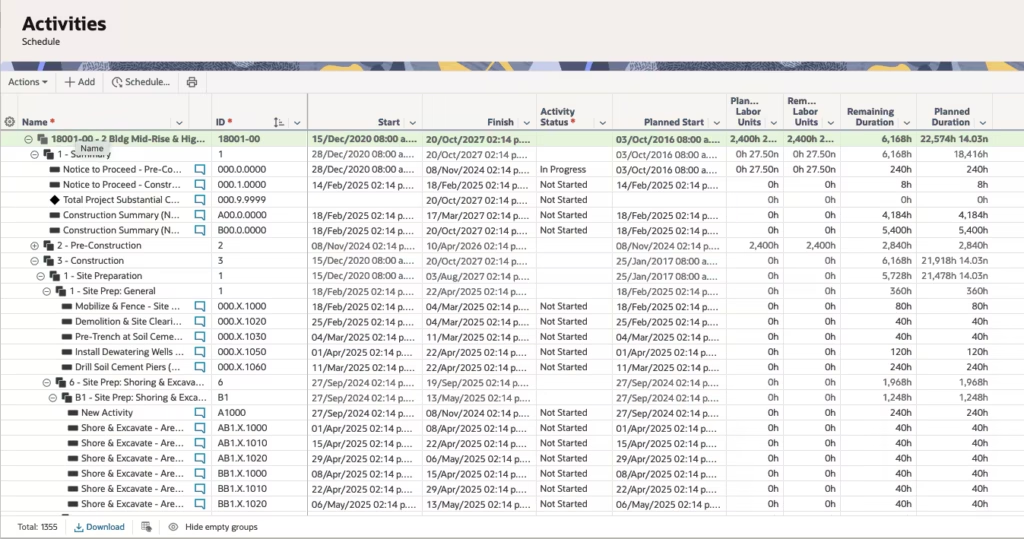
In practice, this means starting with the Scheduling module for drawing up project plans, monitoring progress and managing projects. These components cover the core functionality you are familiar with from Primavera P6: planning activities, allocating resources and monitoring milestones and deadlines. By first mastering this essential module, you will lay a solid foundation. Later you can gradually expand with additional modules, such as the Risk, Task or Costs and Funds module, as soon as the team is ready. This way, the transition remains clear and you avoid users becoming overwhelmed by too many new features at once.
A frequently asked question when switching to new software is how steep the learning curve is and how quickly teams can be productive. Fortunately, OPC has been designed with a modern, user-friendly interface. Many users find the system more intuitive than the old Primavera P6. This means that the training time required can be shorter. With targeted training and guidance, planners, cost controllers, risk managers or other members of the project management team can often master the basics within a few days.
Because OPC is cloud-based, you also don’t have to spend time on technical installations at each workstation. As soon as the environment has been set up and the user accounts have been created, the team can start entering projects and data almost immediately. In practice, you see small project teams switching completely to OPC within a few weeks. Larger organizations take a little more time for a phased implementation – think one to three months – so that everyone becomes familiar with the system and any adjustments to processes can be implemented gradually. It is important to offer sufficient support and opportunities for practice during that period, so that the team builds confidence in the new way of working.
Introducing a new tool is not only a technical change, but also a human one. Creating support among all users is crucial for success. Some tips to get your team excited and involved in the transition:
By paying attention to change management and the various interests of users, you can ensure a smooth transition. Ultimately, employees want to know how OPC helps them in their daily work – show them that, and you will find that adoption goes a lot more smoothly.
What if you are halfway through a project and decide to switch to OPC? Fortunately, transferring ongoing projects does not have to be too difficult, provided you prepare well. A few points to consider:
Data migration – Oracle Primavera Cloud offers options for importing existing Primavera P6 projects (for example via .xer export files). This means you do not have to start from scratch with current projects. It is important to thoroughly check the data after the import. Consider the planning, resources, relationships between tasks and any baseline or progress information. An analytical eye is useful here: is all the data correct and do the reports in OPC match what you were used to? By trying out test projects, you can build confidence that the migration will go smoothly before you transfer critical projects.
Integration – Had you linked Primavera P6 to other systems (such as an ERP system for budgets or a time-logging system)? Then you will have to redesign these integrations for OPC. The good news is that OPC has modern links (APIs), which generally makes technical integration easier than with the old environment. Plan enough time to test and refine all the links so that all the systems continue to work together without any loss of data or delays.
Challenges and points for attention – Keep in mind that OPC is not one-to-one identical to P6. Certain functions work slightly differently or have been improved in OPC. It may take some time for the team to familiarize itself with the new method in ongoing projects. Therefore, consider whether it makes sense to switch in the middle of a critical project, or whether it is better to wait until a project phase has been completed. An alternative is to set up the current project in parallel in OPC (shadow project) and to keep track of both for a while, so that the team can get used to it before switching completely. With a progressive but well-considered approach, you can manage the transition of existing projects without too many hitches.
A successful transition to OPC requires not only new tools, but also a new mindset. BAEKEN supports you during this process by training your team, optimizing workflows and seamlessly integrating OPC into your organization. With a data-driven and innovative approach, we ensure that your projects are managed more efficiently and effectively. Curious about how we can help you utilize OPC to its fullest potential? Contact us and discover the possibilities.
Want to know more about this topic?
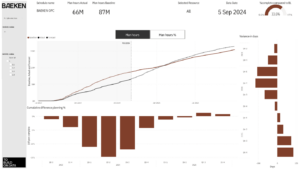
Create an overview of your project with dashboards and improve communication to stakeholders and management. Oracle Primavera Cloud (OPC) offers its own dashboard module for this purpose, which allows you to create visual representations of schedules, risks and costs. Despite this, the dashboard functionality of OPC remains limited when you really need in-depth insights.
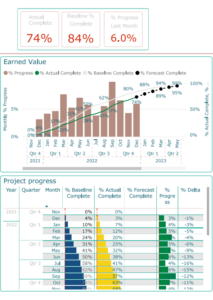

At BAEKEN, we solve this by accessing the data from OPC via an API and further visualizing it in Power BI. In this way, we combine the power of OPC with the flexibility and analysis capabilities of Power BI, leading to smarter insights and better decisions.
OPC’s dashboard module provides a good foundation, such as standard charts and visualizations of project progress, trends, and tasks. OPC also makes it easy to share dashboards with colleagues and team members. Nevertheless, the system has its shortcomings:
As a result, with OPC dashboarding, you are often stuck with superficial insights. For organizations that want more, accessing OPC data via an API is a solution.
At BAEKEN, we use OPC ‘s API to make all available project data instantly and fully accessible. Through this link to Power BI, we bring data together and create in-depth, interactive dashboards that fit the needs of your project, program, or portfolio.
What makes our approach unique?
By integrating OPC data into Power BI, you optimize your project management in a way that matches modern expectations of data-driven decision making. API-driven dashboards not only offer more flexibility, but also provide a broader perspective on project performance, budget monitoring, and resource management. Imagine: one-click access to project performance and the ability to make proactive adjustments at the project level.
At BAEKEN we are experts in accessing OPC data via API and translating complex project information into clear, visual dashboards in Power BI. We make sure your data truly works for you to help you better manage time, cost, and quality.
Contact us and discover how BAEKEN transforms your OPC dashboarding into valuable insights that let your projects, programs, and portfolios excel.
Want to know more about this topic?
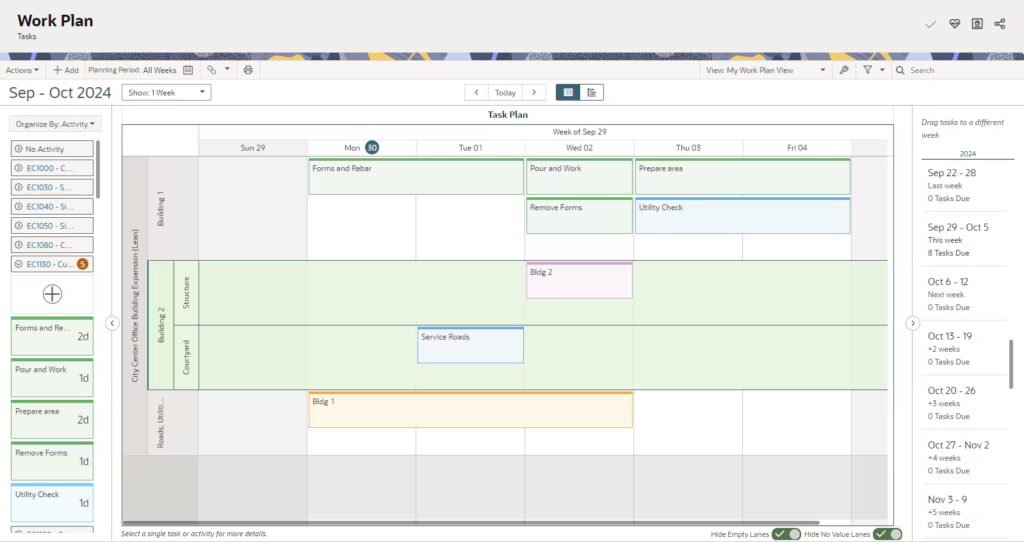
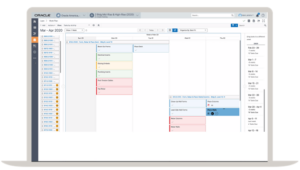
In lean planning, the troublesome but well-known planning method involves the physical “sticker session.” Team members gather around a board, post-its in hand, and stick on their tasks for the week. At the end of the week, the board is rearranged again because not all tasks have been completed. While this method can be effective, there are hefty drawbacks: lack of overview and no direct link to the overall project schedule. In this article, I’ll tell you more about how Oracle Primavera Cloud (OPC) Task can provide a solution to this.

Imagine being able to turn that chaos of paper and post-its into a smooth digital process. OPC offers the perfect solution with the Task Module. No more manually shifting post-its or miscommunicating on tasks. Everything is automatically linked to the relevant activities in the planning. This way, you keep an overview, make sure your team is always in sync and your planners experience less stress processing the lean planning.
With OPC Task, you get a solution that not only meets the modern requirements of project management. It also provides a powerful tool to strengthen collaborations and make progress tangible. BAEKEN is ready to seamlessly integrate this innovative tool into your organization and support you and your team on your way to greater insight and success in planning and execution.
Contact us for a complimentary discussion on how BAEKEN can help you implement the OPC Task Module. Together we will discover the possibilities to take your project management to the next level. Step away from the physical stickers and embrace the future of lean project planning with Oracle Primavera Cloud and BAEKEN!
Want to know more about this topic?
In the past, the Oracle Primavera Cloud (OPC) risk module was found to deviate significantly from Oracle Primavera Risk Analysis (OPRA), the long-established and reliable risk analysis software. The P50 and P80 data in OPC then differed by 30+ working days from the data generated by OPRA. Now we have conducted a risk analysis comparison between OPC and OPRA for a project again, and we report this analysis in detail here.
The risk analyses were performed on all activities with 5000 iterations, without convergence and with the same random seed (1). The example project on which the analyses were performed contained more than 1000 activities and 125 risks, all of which were included. There were initially no uncertainties applied to this project, and subsequently an analysis with uncertainties was performed on all activities. These uncertainties had a minimum of 90%, most likely of 100% and maximum of 130%. The project analyzed spans a period of 5+ years. A risk analysis on costs was also done; this looked at what the effect of linking costs to different risks was. These costs were uniformly distributed with a minimum of 600k and maximum of 1.2 million. The project had three hard constraints regarding start times of three activities. Analyses were performed with and without these constraints. The response context was pre-response because active mitigation had not yet been performed on the project. Finish dates, P50 and P80 values, and deterministic probability were considered.
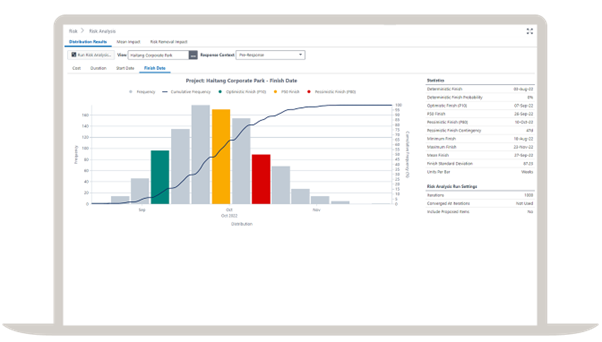
The first comparison of OPC and OPRA shows that for the finish date of the tested project, the P50 and P80 values differed from each other by only 2-3 working days on a P buffer of 180 working days (i.e., the difference between P0 and P50). The deterministic probability was 5% for both OPRA and OPC, indicating that OPC is now reliable. The frequency of finish dates was similar for OPC and OPRA (Figure 1). The only difference was in the maximum date, which differed by 30 working days between OPC and OPRA on a P buffer of 492 working days, with OPRA scheduling the date later. However, this maximum date is an outlier in the 5000 iterations of the analysis, and is almost never reported in projects.
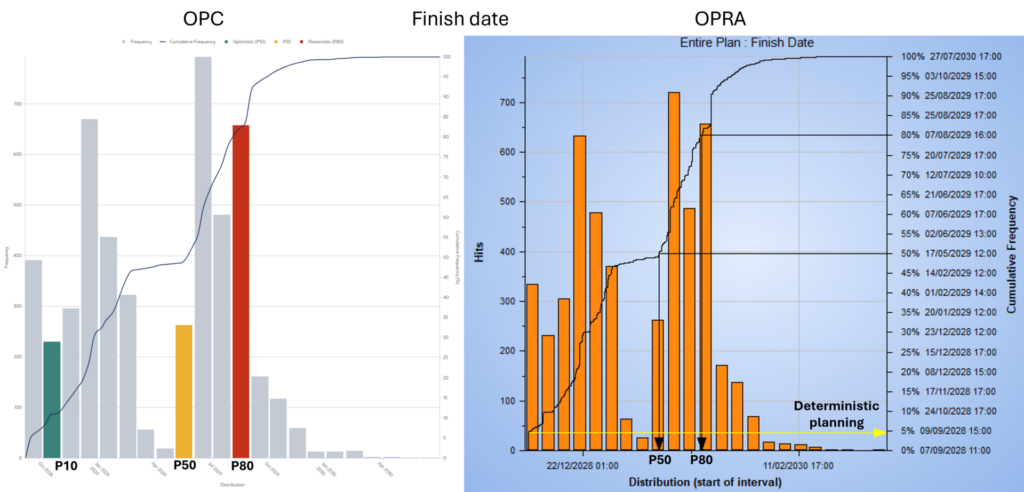
Figure 1. Comparison of the frequency of finish dates of the tested project over 5000 iterations containing P50 and P80 values.
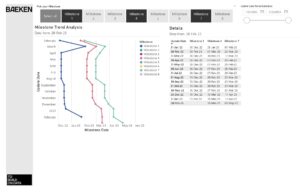
In addition to the finish date of the overall project, we also looked at how the finish dates of intermediate milestones differed in the risk analyses of the two programs. For intermediate milestone 1, the P50 and P80 finish dates differed only 1-2 working days on a P buffer of 112 working days between OPRA and OPC, but for intermediate milestone 2, the P80 milestone had 8 working days of deviation on a P buffer of 152 working days and the P50 was the same for both analyses. The deterministic probability for one milestone was 5% according to the OPRA analysis and 5.9% for OPC, while at the other it was 22% for OPRA and 28.6% for OPC. The frequency graphs of both intermediate milestones show the same trend, as for the finish date of the overall schedule (Figure 2). For both milestones, there was a deviation between OPRA and OPC at the maximum finish date of 30+ working days (32 and 36 respectively on P buffers of 450 and 405 working days).
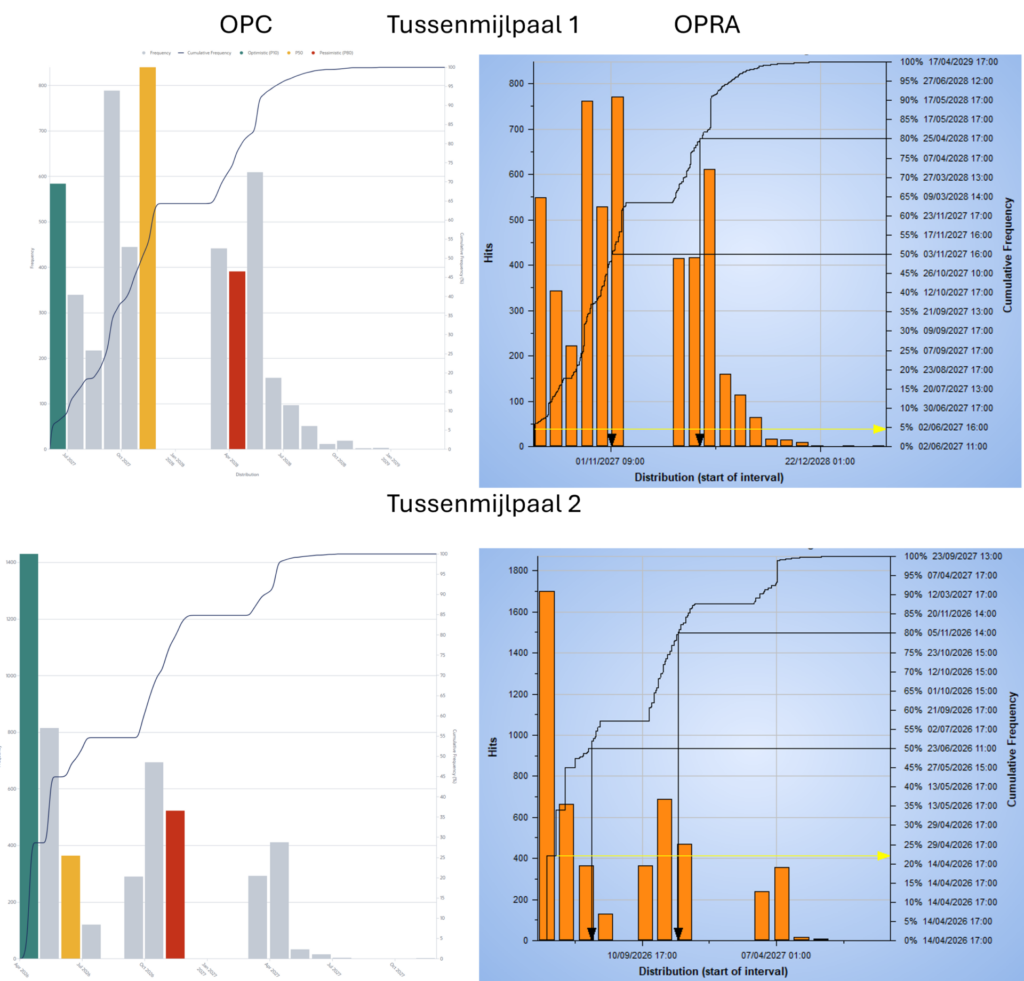
Figure 2. Comparison of the frequency of finish dates for two intermediate milestones of the tested project over 5000 iterations containing P50 and P80 values.
After some adjustments to the risks that followed from a progress update to the schedule, the risk analysis was run again, now with hard constraints on three activities so that these activities would always start on the constraint date. The P50 and P80 finish dates were the same for the OPC and OPRA analysis. The mean finish date also had a deviation of only 1 day out of a difference of 132 working days between mean and P0. There was a difference in deterministic probability though: 7% according to OPRA and 9.1% according to OPC. The maximum finish date had a large difference of 86 working days on a P buffer of 480 working days. The frequency graph again shows an equal trend between OPC and OPRA, but with OPC you see more hits on the deterministic finish date which explains the difference in deterministic probability (Figure 3).
The same analysis was also conducted without the constraints; for the P80 and mean finish dates, the difference between the OPC and OPRA analyses was still only 2-3 working days on 229 working days of P buffer. However, the P50 values had a difference of 27 working days on a P buffer of 174 working days. The frequency graphs were comparable, and this shows that even a very small frequency difference could cause the P50 finish date to differ so much between the two programs (Figure 3). Remarkably however, the deterministic probability of the finish date was almost equal between the OPC and OPRA analysis (5% and 5.4% for OPRA and OPC, respectively).
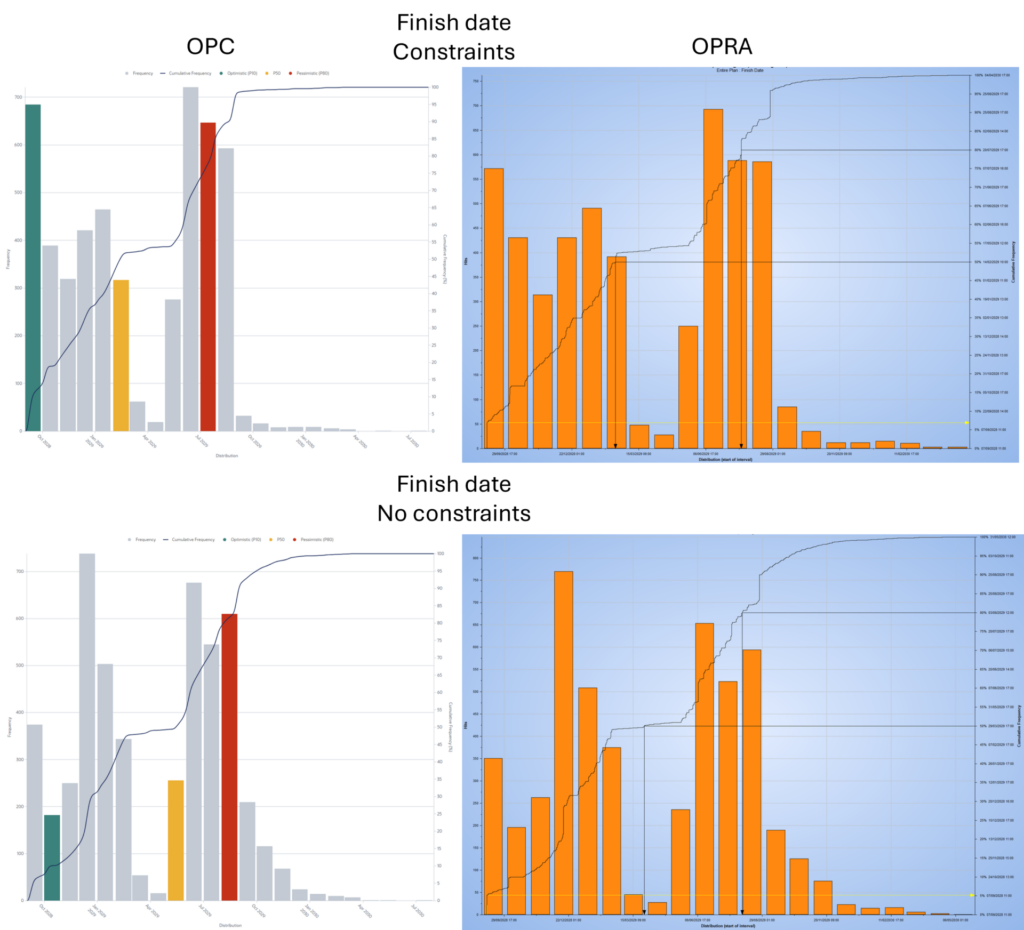
Figure 3. Comparison of the frequency for the finish dates of the overall schedule after being updated with and without constraints on 3 activities of the tested project over 5000 iterations containing P50 and P80 values.
In order to consider also the influence of uncertainties, we conducted an analysis where an uncertainty of minimum 90%, most likely 100%, and maximum 130% was put on all 1000+ activities in addition to their normal risks. While this is an extreme example, it is the best way to compare how the OPC risk module responds compared to OPRA. The difference between OPC and OPRA in P50 and P80 values for the finish date was about 10 working days on a P buffer of 224 working days. This was somewhat larger than in the earlier examples, but still within the ranges that it is acceptable. In this comparison, the minimum finish date also differed by about 10 working days between the OPC and OPRA analyses. (This minimum finish date in all previous analyses was always the same in both comparisons because risks could only give run-out but uncertainties could also give run-in.) The deterministic probability was very low, as expected with so many uncertainties, where OPRA only reported <1%, while OPC was able to calculate a more accurate number (0.02%).
We linked 8 risks, each related to one activity, to costs; this resulted in a deterministic probability (note: deterministic value is not a cost value) of 41% with the risk analysis in OPRA and 39.1% for OPC. The P50 values which were 7.14 ∙ 105 and 7.41 ∙ 105 for OPRA and OPC respectively, also differed from each other by only a few percentage points (3.6%). The P80 values were even closer together with 1.07 ∙ 106 for OPRA and 1.08 ∙ 106 for OPC. The entire distribution of total costs is nearly identical in the OPC and OPRA analyses (Figure 4).
We also discovered through these analyses that the cost is linked to the risk in OPC, but in OPRA to the activity within the risk. Therefore, if the risk occurs then there is a one-time cost associated with it in OPC. If the risk occurs and there are 5 other activities attached to this activity, then in OPRA there will be 5 costs. This means that for risks with multiple activities attached, it is good to realize that OPC and OPRA calculate differently.
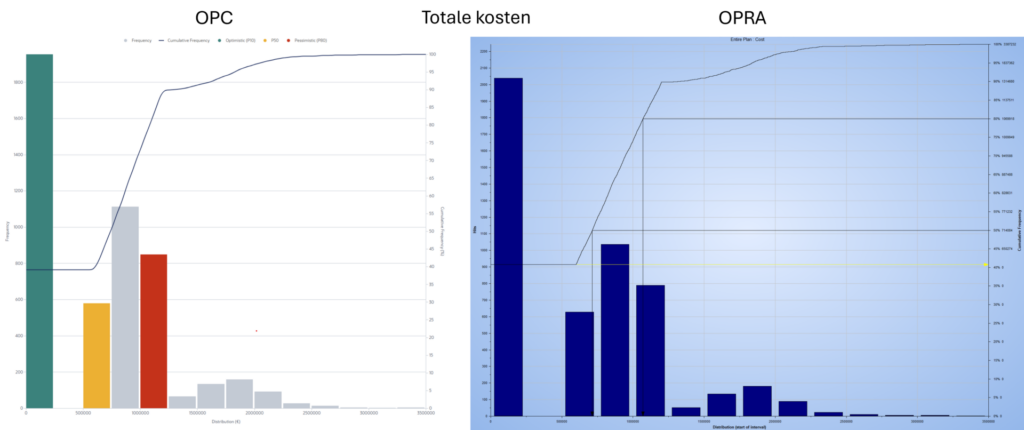
Figure 4. Comparison of the total cost of the tested project over 5000 iterations containing P50 and P80 values. Eight risks with costs were used for this analysis.
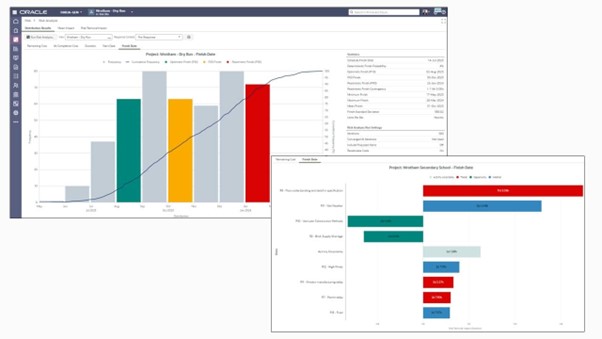
In addition to standard analysis on finish dates and determining P-values, risk analysis is often used to look at which activities and/or risks now have the most impact on the schedule. In OPRA, this involves looking at so-called tornado charts. An example is duration sensitivity, which means how likely the duration of an activity could affect the overall finish date of the project (Figure 5). Also relevant here is criticality index, which represents what percent of iterations an activity is on the project’s critical path.
In OPC, this feature is called mean impact and shows how many days on average an activity and/or risk causes the project to lag. Virtually the same activities appear in the top 10 mean impact (OPC) and duration sensitivity (OPRA) analyses (Figure 5). The only activity that does not appear in the mean impact is activity 3; this activity has a constraint applied to it from the schedule, which may explain as to why OPC does not show it in the mean impact analysis.
These tornado graphs show that OPC does a good job of estimating the mean impact of activities; the program just has a different way of showing the impact of activities and/or risks compared to OPRA.
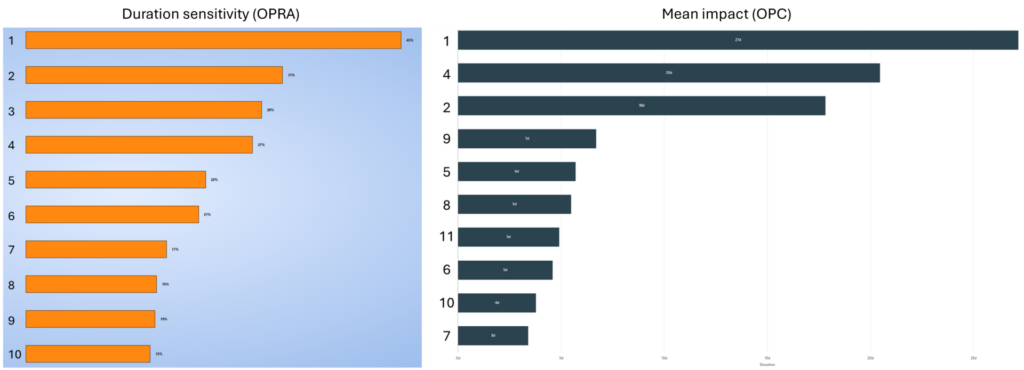
Figure 5. Tornado graphs of risk analysis of the overall schedule after update with constraints which show duration sensitivity from OPRA and mean impact from OPC.
The OPC risk analysis module is now reliable enough to replace OPRA as the standard for risk analysis, even for large-scale and complex projects. This module is more user-friendly than the OPRA software and planning is already integrated into OPC so there is no longer a need to export the schedule separately to perform a risk analysis. In addition, OPC has already integrated weather risks into its risk analysis module and the platform will continue to evolve by adding more risk analysis functionalities.
One of the other main advantages of OPC over OPRA is the new “risk removal impact” functionality. In OPRA, this process must be performed manually, which is time-consuming. With OPC, however, this feature can accurately measure the impact of individual risks on the schedule compared to other risks within the project.
Nevertheless, this does not mean that OPRA can be shelved for good. In fact, the software still offers advanced risk analysis functionalities that OPC currently cannot (yet) perform. The two most important of these are probability branching and criticality index.
Want to know more about this topic?
Oracle Primavera Cloud (OPC) brings risk analysis and project planning together in one powerful platform. Previous analyses showed that the risk module in OPC was not yet reliable enough compared to well-known solutions such as the thorough Oracle Primavera Risk Analysis (OPRA) program. In this article, I explain why OPC Risk is now BAEKEN-approved.
In the past, OPC Risk showed large deviations from expected values, thus it was not reliable enough. Recently, we retested OPC Risk and it now appears that the results are sufficiently reliable such that we have confidence in it.
During this recent test, I compared OPC Risk with OPRA. Both the P values at the finish date and intermediate milestones were analyzed. Furthermore, I examined the impact of uncertainties and constraints on planning, as well as the effects of tasks and risks via tornado graphs. Finally, I mapped the impact of risks on project costs. This analysis showed that the P-values of the finish date in OPC are now as expected instead of deviations of 30+ days, as was previously the case relative to OPRA. For the full analysis of all aspects examined in this study, read here.
Thanks to these improvements, OPC Risk is now reliable enough and therefore BAEKEN-approved for use in all your risk analyses, even on large and complex projects. OPC Risk’s ease of use and seamless integration with other OPC modules, covering all facets of Project Control, Project Management, and Portfolio Management, make OPC Risk the new standard for risk analysis.
BAEKEN helps you fully leverage OPC as part of your project strategy. We are committed to a data-driven and sustainable project approach and support teams in successfully implementing OPC aligned with your goals.
With a focus on collaboration, innovation, and control over risk, BAEKEN provides not only technology, but also the expertise to take your projects to the next level. Are you ready to step up to efficient risk management?
Meer over dit onderwerp weten?
In a world where projects are becoming increasingly complex, effective project management is essential for success. As your trusted partner in advanced project management, BAEKEN uses Oracle Primavera Cloud (OPC) to provide insight and control in high-tech innovations, energy transition, area development, and infrastructure projects. In this article, we will show you why and when you should consider OPC for your projects.
OPC is a comprehensive, cloud-based project management suite designed for large and complex projects. It serves as the cloud-based successor to the well-known on-premise Primavera P6 solution.
Whether managing individual projects or an entire project portfolio, OPC offers the tools to oversee projects from start to finish. This enables efficient planning, stakeholder alignment, monitoring, and optimization, with a strong focus on time, cost, and risk management.
Unlike Primavera P6, which requires extensive network configurations and periodic local updates, OPC eliminates the need for maintaining servers, networks, and manual updates.
You should consider OPC when starting complex projects involving multiple stakeholders, where time and cost control are crucial. At the launch of a new project, OPC is an attractive option because it allows for rapid implementation with minimal setup time.
Even if your project is already underway, switching to OPC can be beneficial, especially if you’re currently using Excel, Microsoft Project, or other limited software solutions. Beyond just data migration, Primavera solutions provide greater control over scheduling, offering the project team more realistic and actionable insights.
If you’re interested in data migration or need guidance on restructuring your PMO, feel free to reach out.
OPC is particularly suited for industries like construction, energy, and infrastructure, where precise planning and risk management are essential. It also offers integration capabilities with other systems and data analysis platforms, enabling seamless workflows and better project performance insights.
1. Data-Driven Project Control
At BAEKEN, we optimize project performance with detailed data analysis in OPC. The platform makes it easy to collect, verify, and visualize project data, ensuring full transparency on project status. This aligns with our core value of analytical excellence, turning data into valuable insights for better decision-making.

2. Enhanced Collaboration & Stakeholder Management
At BAEKEN, we believe in strong, long-term partnerships with all stakeholders. OPC simplifies collaboration by providing real-time access to critical project information for both internal teams and external stakeholders. This not only improves communication and transparency but also enhances alignment and proactively resolves conflicts.
3. Risk Management & Probabilistic Planning
One of OPC’s unique features is its ability to integrate risk management into project planning. With BAEKEN’s expertise in OPC, we help manage uncertainties in scheduling while maximizing opportunities. Probabilistic planning enables teams to model scenarios and make accurate predictions about the impact of potential risks.
4. Scalable & Future-Proof
Whether managing a small project team or a global network of stakeholders, OPC is scalable and can adapt to the needs of any project. Its cloud-based infrastructure ensures flexibility, growth potential, and access to continuous innovations in project management.
5. Lean Planning: Seamlessly Integrated with OPC
In many traditional planning environments like Primavera P6, Lean planning is often handled separately (e.g., manual sticker boards). With OPC, this fragmented approach is eliminated. The Lean module is fully integrated within OPC, providing a structured and visual overview of daily activities, leading to a more flexible and streamlined project execution.
For years, Primavera P6 has been the gold standard for planning software in complex project environments. It remains a powerful and reliable tool for project planning and control. However, its outdated interface and steep learning curve limit usability for non-expert users, such as stakeholders and execution teams, who need clear visibility into project planning. Additionally, P6 requires on-premise hosting, which demands IT infrastructure and maintenance.
This is where OPC becomes the modern, cloud-based successor to P6.With OPC, you not only get the same powerful planning functionality, but also a modern, user-friendly interface that is equally accessible to stakeholders and implementers, and the flexibility of a cloud-based environment. Furthermore, OPC is not just a planning tool like P6, but a project management tool that also integrates many other modules such as risk, cost, lean planning and portfolio management.
In short, Oracle Primavera Cloud is now truly ready for the future of project management. It combines the strong foundation of P6 with the modern technologies needed to successfully manage projects in today’s time.
At BAEKEN, we believe in delivering sustainable solutions that fit the ever-changing world. Our expertise in Oracle Primavera Cloud allows us to master not only the technical aspects of project management, but also the human side. We understand that every project is unique, and we apply OPC in a way that supports your specific goals, with attention to innovation, sustainability, and stakeholder relations.
OPC helps us deliver on our promise: To enjoy creating support and insight to create impactful projects successfully.
With our deep knowledge of project controls, complemented by the powerful tools of Oracle Primavera Cloud, we ensure that projects are completed successfully, on time, and on budget.
Oracle Primavera Cloud is not just another tool; it is a solution that builds on Primavera P6 and contributes to the strategic goals of organizations. At BAEKEN, we combine our expertise in Project Controls with OPC’s innovative capabilities to deliver sustainable, successful projects.
Are you ready to take project management to the next level? Contact us and find out how OPC can transform your next project.
Want to know more about this topic?