
Create an overview of your project with dashboards and improve communication to stakeholders and management. Oracle Primavera Cloud (OPC) offers its own dashboard module for this purpose, which allows you to create visual representations of schedules, risks and costs. Despite this, the dashboard functionality of OPC remains limited when you really need in-depth insights.
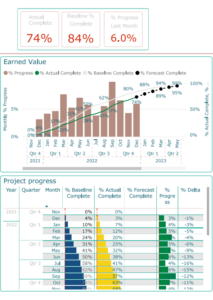
At BAEKEN, we solve this by accessing the data from OPC via an API and further visualizing it in Power BI. In this way, we combine the power of OPC with the flexibility and analysis capabilities of Power BI, leading to smarter insights and better decisions.
OPC’s dashboard module provides a good foundation, such as standard charts and visualizations of project progress, trends, and tasks. OPC also makes it easy to share dashboards with colleagues and team members. Nevertheless, the system has its shortcomings:
As a result, with OPC dashboarding, you are often stuck with superficial insights. For organizations that want more, accessing OPC data via an API is a solution.
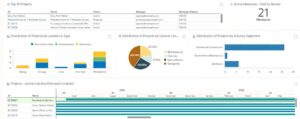
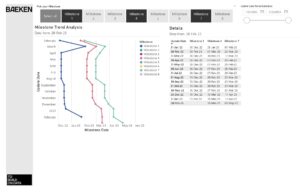
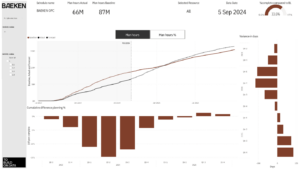
At BAEKEN, we use OPC ‘s API to make all available project data instantly and fully accessible. Through this link to Power BI, we bring data together and create in-depth, interactive dashboards that fit the needs of your project, program, or portfolio.
What makes our approach unique?
By integrating OPC data into Power BI, you optimize your project management in a way that matches modern expectations of data-driven decision making. API-driven dashboards not only offer more flexibility, but also provide a broader perspective on project performance, budget monitoring, and resource management. Imagine: one-click access to project performance and the ability to make proactive adjustments at the project level.
At BAEKEN we are experts in accessing OPC data via API and translating complex project information into clear, visual dashboards in Power BI. We make sure your data truly works for you to help you better manage time, cost, and quality.
Contact us and discover how BAEKEN transforms your OPC dashboarding into valuable insights that let your projects, programs, and portfolios excel.
Want to know more about this topic?