
In the past, the Oracle Primavera Cloud (OPC) risk module was found to deviate significantly from Oracle Primavera Risk Analysis (OPRA), the long-established and reliable risk analysis software. The P50 and P80 data in OPC then differed by 30+ working days from the data generated by OPRA. Now we have conducted a risk analysis comparison between OPC and OPRA for a project again, and we report this analysis in detail here.
The risk analyses were performed on all activities with 5000 iterations, without convergence and with the same random seed (1). The example project on which the analyses were performed contained more than 1000 activities and 125 risks, all of which were included. There were initially no uncertainties applied to this project, and subsequently an analysis with uncertainties was performed on all activities. These uncertainties had a minimum of 90%, most likely of 100% and maximum of 130%. The project analyzed spans a period of 5+ years. A risk analysis on costs was also done; this looked at what the effect of linking costs to different risks was. These costs were uniformly distributed with a minimum of 600k and maximum of 1.2 million. The project had three hard constraints regarding start times of three activities. Analyses were performed with and without these constraints. The response context was pre-response because active mitigation had not yet been performed on the project. Finish dates, P50 and P80 values, and deterministic probability were considered.
The first comparison of OPC and OPRA shows that for the finish date of the tested project, the P50 and P80 values differed from each other by only 2-3 working days on a P buffer of 180 working days (i.e., the difference between P0 and P50). The deterministic probability was 5% for both OPRA and OPC, indicating that OPC is now reliable. The frequency of finish dates was similar for OPC and OPRA (Figure 1). The only difference was in the maximum date, which differed by 30 working days between OPC and OPRA on a P buffer of 492 working days, with OPRA scheduling the date later. However, this maximum date is an outlier in the 5000 iterations of the analysis, and is almost never reported in projects.
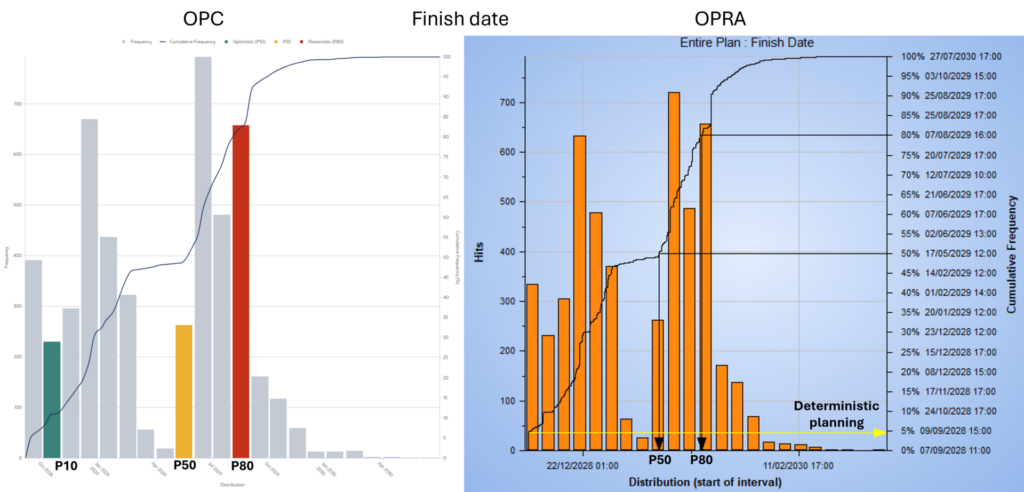
Figure 1. Comparison of the frequency of finish dates of the tested project over 5000 iterations containing P50 and P80 values.
In addition to the finish date of the overall project, we also looked at how the finish dates of intermediate milestones differed in the risk analyses of the two programs. For intermediate milestone 1, the P50 and P80 finish dates differed only 1-2 working days on a P buffer of 112 working days between OPRA and OPC, but for intermediate milestone 2, the P80 milestone had 8 working days of deviation on a P buffer of 152 working days and the P50 was the same for both analyses. The deterministic probability for one milestone was 5% according to the OPRA analysis and 5.9% for OPC, while at the other it was 22% for OPRA and 28.6% for OPC. The frequency graphs of both intermediate milestones show the same trend, as for the finish date of the overall schedule (Figure 2). For both milestones, there was a deviation between OPRA and OPC at the maximum finish date of 30+ working days (32 and 36 respectively on P buffers of 450 and 405 working days).
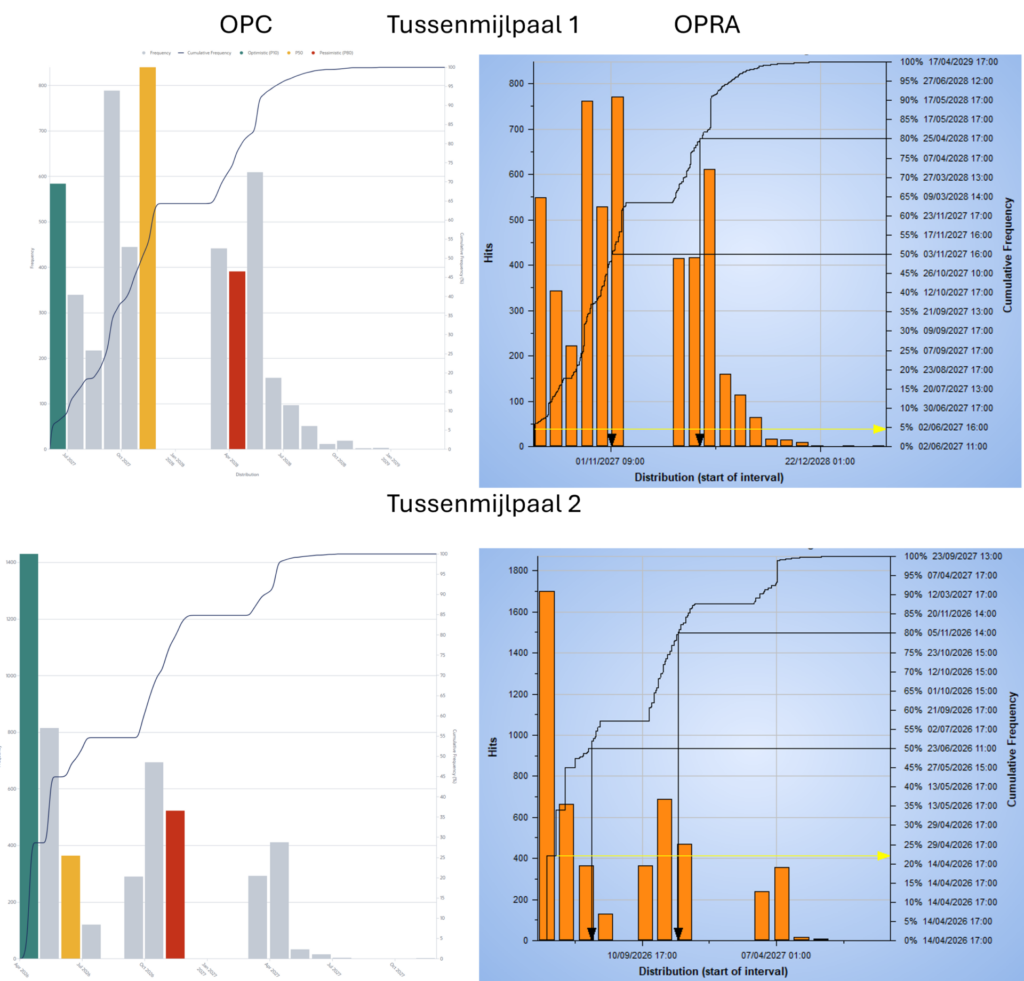
Figure 2. Comparison of the frequency of finish dates for two intermediate milestones of the tested project over 5000 iterations containing P50 and P80 values.
After some adjustments to the risks that followed from a progress update to the schedule, the risk analysis was run again, now with hard constraints on three activities so that these activities would always start on the constraint date. The P50 and P80 finish dates were the same for the OPC and OPRA analysis. The mean finish date also had a deviation of only 1 day out of a difference of 132 working days between mean and P0. There was a difference in deterministic probability though: 7% according to OPRA and 9.1% according to OPC. The maximum finish date had a large difference of 86 working days on a P buffer of 480 working days. The frequency graph again shows an equal trend between OPC and OPRA, but with OPC you see more hits on the deterministic finish date which explains the difference in deterministic probability (Figure 3).
The same analysis was also conducted without the constraints; for the P80 and mean finish dates, the difference between the OPC and OPRA analyses was still only 2-3 working days on 229 working days of P buffer. However, the P50 values had a difference of 27 working days on a P buffer of 174 working days. The frequency graphs were comparable, and this shows that even a very small frequency difference could cause the P50 finish date to differ so much between the two programs (Figure 3). Remarkably however, the deterministic probability of the finish date was almost equal between the OPC and OPRA analysis (5% and 5.4% for OPRA and OPC, respectively).
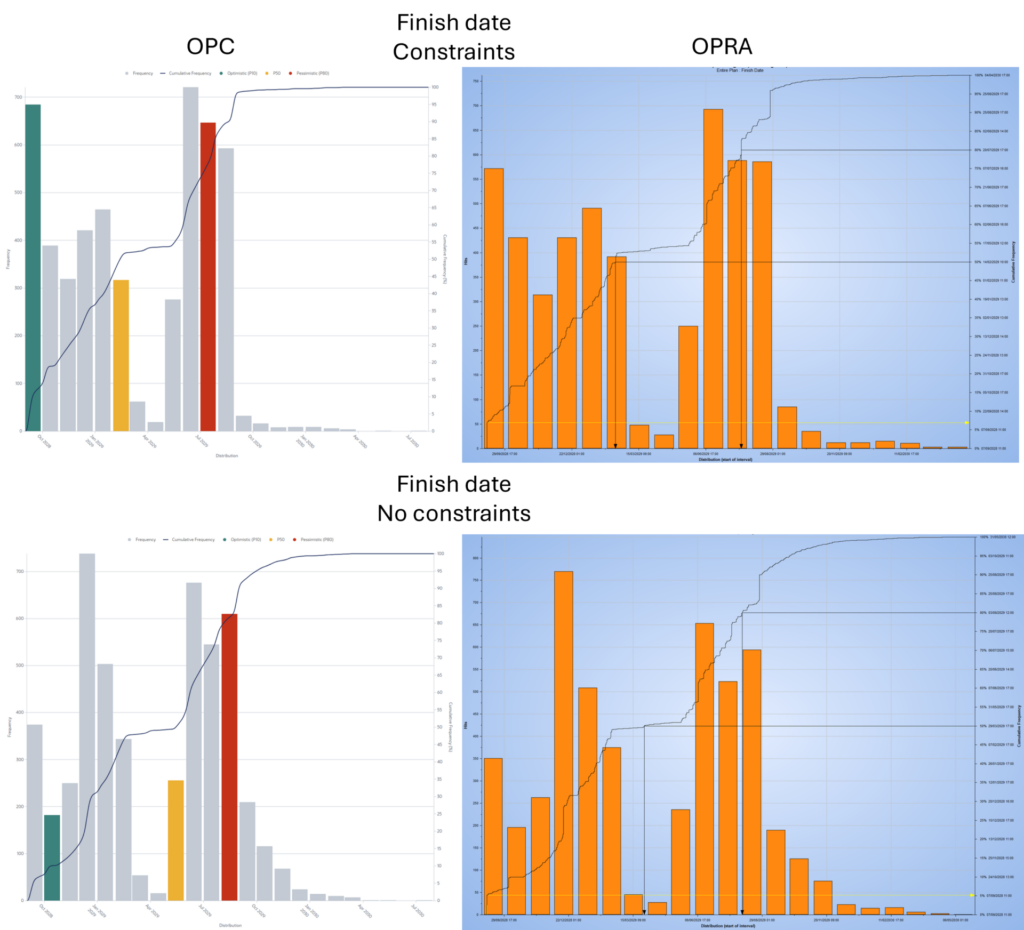
Figure 3. Comparison of the frequency for the finish dates of the overall schedule after being updated with and without constraints on 3 activities of the tested project over 5000 iterations containing P50 and P80 values.
In order to consider also the influence of uncertainties, we conducted an analysis where an uncertainty of minimum 90%, most likely 100%, and maximum 130% was put on all 1000+ activities in addition to their normal risks. While this is an extreme example, it is the best way to compare how the OPC risk module responds compared to OPRA. The difference between OPC and OPRA in P50 and P80 values for the finish date was about 10 working days on a P buffer of 224 working days. This was somewhat larger than in the earlier examples, but still within the ranges that it is acceptable. In this comparison, the minimum finish date also differed by about 10 working days between the OPC and OPRA analyses. (This minimum finish date in all previous analyses was always the same in both comparisons because risks could only give run-out but uncertainties could also give run-in.) The deterministic probability was very low, as expected with so many uncertainties, where OPRA only reported <1%, while OPC was able to calculate a more accurate number (0.02%).
We linked 8 risks, each related to one activity, to costs; this resulted in a deterministic probability (note: deterministic value is not a cost value) of 41% with the risk analysis in OPRA and 39.1% for OPC. The P50 values which were 7.14 ∙ 105 and 7.41 ∙ 105 for OPRA and OPC respectively, also differed from each other by only a few percentage points (3.6%). The P80 values were even closer together with 1.07 ∙ 106 for OPRA and 1.08 ∙ 106 for OPC. The entire distribution of total costs is nearly identical in the OPC and OPRA analyses (Figure 4).
We also discovered through these analyses that the cost is linked to the risk in OPC, but in OPRA to the activity within the risk. Therefore, if the risk occurs then there is a one-time cost associated with it in OPC. If the risk occurs and there are 5 other activities attached to this activity, then in OPRA there will be 5 costs. This means that for risks with multiple activities attached, it is good to realize that OPC and OPRA calculate differently.
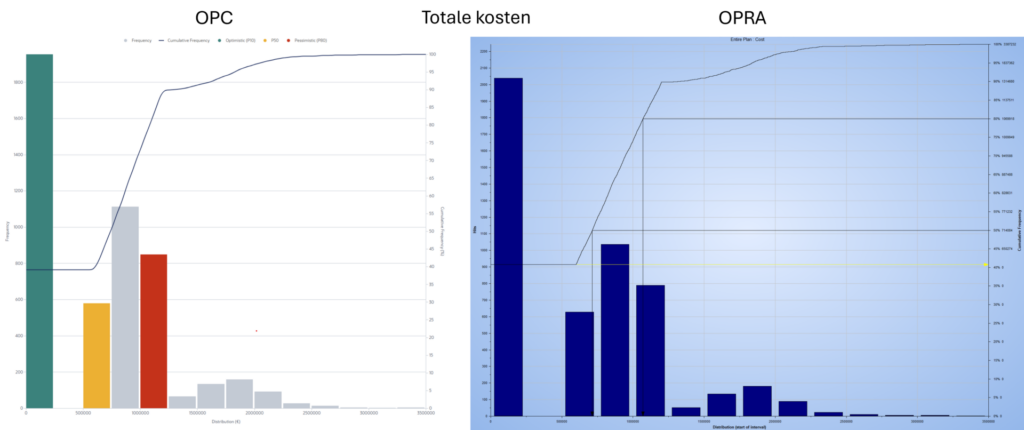
Figure 4. Comparison of the total cost of the tested project over 5000 iterations containing P50 and P80 values. Eight risks with costs were used for this analysis.
In addition to standard analysis on finish dates and determining P-values, risk analysis is often used to look at which activities and/or risks now have the most impact on the schedule. In OPRA, this involves looking at so-called tornado charts. An example is duration sensitivity, which means how likely the duration of an activity could affect the overall finish date of the project (Figure 5). Also relevant here is criticality index, which represents what percent of iterations an activity is on the project’s critical path.
In OPC, this feature is called mean impact and shows how many days on average an activity and/or risk causes the project to lag. Virtually the same activities appear in the top 10 mean impact (OPC) and duration sensitivity (OPRA) analyses (Figure 5). The only activity that does not appear in the mean impact is activity 3; this activity has a constraint applied to it from the schedule, which may explain as to why OPC does not show it in the mean impact analysis.
These tornado graphs show that OPC does a good job of estimating the mean impact of activities; the program just has a different way of showing the impact of activities and/or risks compared to OPRA.
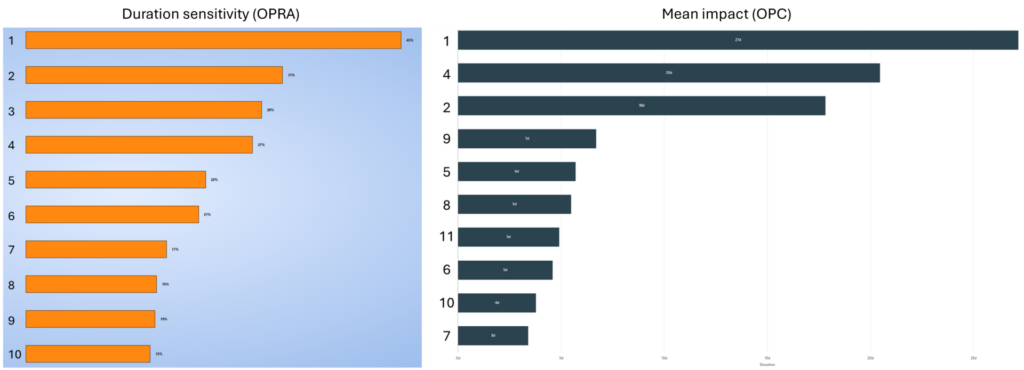
Figure 5. Tornado graphs of risk analysis of the overall schedule after update with constraints which show duration sensitivity from OPRA and mean impact from OPC.
The OPC risk analysis module is now reliable enough to replace OPRA as the standard for risk analysis, even for large-scale and complex projects. This module is more user-friendly than the OPRA software and planning is already integrated into OPC so there is no longer a need to export the schedule separately to perform a risk analysis. In addition, OPC has already integrated weather risks into its risk analysis module and the platform will continue to evolve by adding more risk analysis functionalities.
One of the other main advantages of OPC over OPRA is the new “risk removal impact” functionality. In OPRA, this process must be performed manually, which is time-consuming. With OPC, however, this feature can accurately measure the impact of individual risks on the schedule compared to other risks within the project.
Nevertheless, this does not mean that OPRA can be shelved for good. In fact, the software still offers advanced risk analysis functionalities that OPC currently cannot (yet) perform. The two most important of these are probability branching and criticality index.
Want to know more about this topic?