Ga naar de content

Comprehensive analysis of Oracle Primavera Cloud (OPC) Risk vs OPRA

Introduction

In the past, the Oracle Primavera Cloud (OPC) risk module was found to deviate significantly from Oracle Primavera Risk Analysis (OPRA), the long-established and reliable risk analysis software. The P50 and P80 data in OPC then differed by 30+ working days from the data generated by OPRA. Now we have conducted a risk analysis comparison between OPC and OPRA for a project again, and we report this analysis in detail here.

Method

The risk analyses were performed on all activities with 5000 iterations, without convergence and with the same random seed (1). The example project on which the analyses were performed contained more than 1000 activities and 125 risks, all of which were included. There were initially no uncertainties applied to this project, and subsequently an analysis with uncertainties was performed on all activities. These uncertainties had a minimum of 90%, most likely of 100% and maximum of 130%. The project analyzed spans a period of 5+ years. A risk analysis on costs was also done; this looked at what the effect of linking costs to different risks was. These costs were uniformly distributed with a minimum of 600k and maximum of 1.2 million. The project had three hard constraints regarding start times of three activities. Analyses were performed with and without these constraints. The response context was pre-response because active mitigation had not yet been performed on the project. Finish dates, P50 and P80 values, and deterministic probability were considered.

Results

The first comparison of OPC and OPRA shows that for the finish date of the tested project, the P50 and P80 values differed from each other by only 2-3 working days on a P buffer of 180 working days (i.e., the difference between P0 and P50). The deterministic probability was 5% for both OPRA and OPC, indicating that OPC is now reliable. The frequency of finish dates was similar for OPC and OPRA (Figure 1). The only difference was in the maximum date, which differed by 30 working days between OPC and OPRA on a P buffer of 492 working days, with OPRA scheduling the date later. However, this maximum date is an outlier in the 5000 iterations of the analysis, and is almost never reported in projects.

Figure 1. Comparison of the frequency of finish dates of the tested project over 5000 iterations containing P50 and P80 values.

In addition to the finish date of the overall project, we also looked at how the finish dates of intermediate milestones differed in the risk analyses of the two programs. For intermediate milestone 1, the P50 and P80 finish dates differed only 1-2 working days on a P buffer of 112 working days between OPRA and OPC, but for intermediate milestone 2, the P80 milestone had 8 working days of deviation on a P buffer of 152 working days and the P50 was the same for both analyses. The deterministic probability for one milestone was 5% according to the OPRA analysis and 5.9% for OPC, while at the other it was 22% for OPRA and 28.6% for OPC. The frequency graphs of both intermediate milestones show the same trend, as for the finish date of the overall schedule (Figure 2). For both milestones, there was a deviation between OPRA and OPC at the maximum finish date of 30+ working days (32 and 36 respectively on P buffers of 450 and 405 working days).

Figure 2. Comparison of the frequency of finish dates for two intermediate milestones of the tested project over 5000 iterations containing P50 and P80 values.

After some adjustments to the risks that followed from a progress update to the schedule, the risk analysis was run again, now with hard constraints on three activities so that these activities would always start on the constraint date. The P50 and P80 finish dates were the same for the OPC and OPRA analysis. The mean finish date also had a deviation of only 1 day out of a difference of 132 working days between mean and P0. There was a difference in deterministic probability though: 7% according to OPRA and 9.1% according to OPC. The maximum finish date had a large difference of 86 working days on a P buffer of 480 working days. The frequency graph again shows an equal trend between OPC and OPRA, but with OPC you see more hits on the deterministic finish date which explains the difference in deterministic probability (Figure 3).

The same analysis was also conducted without the constraints; for the P80 and mean finish dates, the difference between the OPC and OPRA analyses was still only 2-3 working days on 229 working days of P buffer. However, the P50 values had a difference of 27 working days on a P buffer of 174 working days. The frequency graphs were comparable, and this shows that even a very small frequency difference could cause the P50 finish date to differ so much between the two programs (Figure 3). Remarkably however, the deterministic probability of the finish date was almost equal between the OPC and OPRA analysis (5% and 5.4% for OPRA and OPC, respectively).

Figure 3. Comparison of the frequency for the finish dates of the overall schedule after being updated with and without constraints on 3 activities of the tested project over 5000 iterations containing P50 and P80 values.

Uncertainties

In order to consider also the influence of uncertainties, we conducted an analysis where an uncertainty of minimum 90%, most likely 100%, and maximum 130% was put on all 1000+ activities in addition to their normal risks. While this is an extreme example, it is the best way to compare how the OPC risk module responds compared to OPRA. The difference between OPC and OPRA in P50 and P80 values for the finish date was about 10 working days on a P buffer of 224 working days. This was somewhat larger than in the earlier examples, but still within the ranges that it is acceptable. In this comparison, the minimum finish date also differed by about 10 working days between the OPC and OPRA analyses. (This minimum finish date in all previous analyses was always the same in both comparisons because risks could only give run-out but uncertainties could also give run-in.) The deterministic probability was very low, as expected with so many uncertainties, where OPRA only reported <1%, while OPC was able to calculate a more accurate number (0.02%).

Risks with costs

We linked 8 risks, each related to one activity, to costs; this resulted in a deterministic probability (note: deterministic value is not a cost value) of 41% with the risk analysis in OPRA and 39.1% for OPC. The P50 values which were 7.14 ∙ 105 and 7.41 ∙ 105 for OPRA and OPC respectively, also differed from each other by only a few percentage points (3.6%). The P80 values were even closer together with 1.07 ∙ 106 for OPRA and 1.08 ∙ 106 for OPC. The entire distribution of total costs is nearly identical in the OPC and OPRA analyses (Figure 4).

We also discovered through these analyses that the cost is linked to the risk in OPC, but in OPRA to the activity within the risk. Therefore, if the risk occurs then there is a one-time cost associated with it in OPC. If the risk occurs and there are 5 other activities attached to this activity, then in OPRA there will be 5 costs. This means that for risks with multiple activities attached, it is good to realize that OPC and OPRA calculate differently.

Figure 4. Comparison of the total cost of the tested project over 5000 iterations containing P50 and P80 values. Eight risks with costs were used for this analysis.

Tornado graphs

In addition to standard analysis on finish dates and determining P-values, risk analysis is often used to look at which activities and/or risks now have the most impact on the schedule. In OPRA, this involves looking at so-called tornado charts. An example is duration sensitivity, which means how likely the duration of an activity could affect the overall finish date of the project (Figure 5). Also relevant here is criticality index, which represents what percent of iterations an activity is on the project’s critical path.

In OPC, this feature is called mean impact and shows how many days on average an activity and/or risk causes the project to lag. Virtually the same activities appear in the top 10 mean impact (OPC) and duration sensitivity (OPRA) analyses (Figure 5). The only activity that does not appear in the mean impact is activity 3; this activity has a constraint applied to it from the schedule, which may explain as to why OPC does not show it in the mean impact analysis.

These tornado graphs show that OPC does a good job of estimating the mean impact of activities; the program just has a different way of showing the impact of activities and/or risks compared to OPRA.

Figure 5. Tornado graphs of risk analysis of the overall schedule after update with constraints which show duration sensitivity from OPRA and mean impact from OPC.

Conclusion and discussion OPC to become the new standard for risk analysis, but when to use OPRA?

The OPC risk analysis module is now reliable enough to replace OPRA as the standard for risk analysis, even for large-scale and complex projects. This module is more user-friendly than the OPRA software and planning is already integrated into OPC so there is no longer a need to export the schedule separately to perform a risk analysis. In addition, OPC has already integrated weather risks into its risk analysis module and the platform will continue to evolve by adding more risk analysis functionalities.

One of the other main advantages of OPC over OPRA is the new “risk removal impact” functionality. In OPRA, this process must be performed manually, which is time-consuming. With OPC, however, this feature can accurately measure the impact of individual risks on the schedule compared to other risks within the project.

Nevertheless, this does not mean that OPRA can be shelved for good. In fact, the software still offers advanced risk analysis functionalities that OPC currently cannot (yet) perform. The two most important of these are probability branching and criticality index.

OPC Risk: BAEKEN APPROVED

Oracle Primavera Cloud (OPC) brings risk analysis and project planning together in one powerful platform. Previous analyses showed that the risk module in OPC was not yet reliable enough compared to well-known solutions such as the thorough Oracle Primavera Risk Analysis (OPRA) program. In this article, I explain why OPC Risk is now BAEKEN-approved.

Why choose OPC Risk?

  • Simple and direct
    With OPC, you perform risk management Risk management includes more than most people think – BAEKEN and planning within one platform, without exporting or complex steps. The integrated scoring matrix for qualitative risks can also be standardized across the organization. This means that risk analysis and management can be seamlessly integrated and compared across multiple projects. Risk analyses can also be displayed via dashboards for better communication to different stakeholders. This all-in-one approach saves time, keeps projects organized, and prevents errors.
  • Advanced features such as Risk Removal Impact
    OPC Risk offers the new feature “Risk Removal Impact,” which allows you to directly analyze the impact of individual risks; the net effect of each risk on your P-value is immediately apparent. In OPRA, this analysis had to be done manually by removing one risk at a time and redoing the risk analysis. This tool gives you more control and insight, which is essential in large projects.
  • Continuous innovation
    OPC continues to evolve and regularly adds new features, such as weather risks. Although OPRA still has unique advanced options, like probability branching and criticality index, OPC continues to better suit advanced risk analysis needs.

OPC Risk vs. OPRA

In the past, OPC Risk showed large deviations from expected values, thus it was not reliable enough. Recently, we retested OPC Risk and it now appears that the results are sufficiently reliable such that we have confidence in it.

During this recent test, I compared OPC Risk with OPRA. Both the P values at the finish date and intermediate milestones were analyzed. Furthermore, I examined the impact of uncertainties and constraints on planning, as well as the effects of tasks and risks via tornado graphs. Finally, I mapped the impact of risks on project costs. This analysis showed that the P-values of the finish date in OPC are now as expected instead of deviations of 30+ days, as was previously the case relative to OPRA. For the full analysis of all aspects examined in this study, read hereComprehensive analysis of Oracle Primavera Cloud (OPC) Risk vs OPRA – BAEKEN.

Thanks to these improvements, OPC Risk is now reliable enough and therefore BAEKEN-approved for use in all your risk analyses, even on large and complex projects. OPC Risk’s ease of use and seamless integration with other OPC modules, covering all facets of Project Control, Project Management, and Portfolio Management, make OPC Risk the new standard for risk analysis.

BAEKEN: Your partner in reliable risk management

Risk management – BAEKEN

BAEKEN helps you fully leverage OPC as part of your project strategy. We are committed to a data-driven and sustainable project approach and support teams in successfully implementing OPC aligned with your goals.

With a focus on collaboration, innovation, and control over risk, BAEKEN provides not only technology, but also the expertise to take your projects to the next level. Are you ready to step up to efficient risk management?

The BAEKEN Training Program

Kickstart your career

At BAEKEN we understand that the key to successful project management lies in the combination of technical expertise, strategic insight, and empathetic collaboration. That is why we have developed an intensive two-month training program aimed at training the next generation of Project Controls Consultants.

What are we working on?

Your competences!

The training program is designed to develop the following core competences:

  1. Technical Skills: Participants will become familiar with advanced planning and risk management tools. This includes not only using the tools, but also understanding the underlying principles that allow them to manage projects efficiently.
  2. Analytical Skills: The ability to analyze and present complex information is crucial in project management. Participants learn how to convert raw data into actionable insights and how to communicate these insights to different stakeholders.
  3. Theoretical Knowledge: An in-depth understanding of all project management fields, including management techniquesm is essential. Participants will learn how to make complex projects run more efficiently and how they can help save failure costs.
  4. Soft Skills: Success in project management is not just about technical proficiency; it is also about the ability to work effectively in a team and to involve others in the process. This part of the program focuses on developing these essential human skills.
Get started right away?

How We Teach

At BAEKEN, we believe that learning is most effective when it is approached from different angles. That is why we have developed a varied approach to educate participants in the different aspects of project management:

  1. Explanation: Our project controls experts provide detailed explanations and insights into the theory behind planning, risk management, analysis, management techniques and soft skills. This foundation of knowledge is essential for understanding the complex dynamics of project management.
  2. Examples: We use real-world examples to bring the theory to life. By demonstrating how concepts are applied to real projects, participants can see the practical value of what they learn.
  3. Practice-oriented Assignments: The participants are given the opportunity to work on assignments that are based on practice. This allows them to apply the skills thay have learned in a controlled environment, where they can experiment and learn from their mistakes.
  4. Interactive Workshops: Through workshops and group activities, participants work together to solve problems and plan projects. This not only improves their technical skills but also helps develop teamwork and communication.
  5. Soft Skills Training: Special sessions are dedicated to developing soft skills such as collaboration, leadership and communication. This includes both theoretical discussions and practical exercises to strenghten these essential skills.

This combined approach ensures that participants not only acquire the knowledge they need, but also the practical skills to apply that knowledge. It is a holistic approach to education that prepares then to participate in real-world projects with confidence and competence.

Guidance and Application

After completing the training program, each participant will have the opportunity to apply the newly acquired skills in a real project. Under the guidance of an experienced mentor, you will receive intensive guidance during the first 6 months. But the training process does not stop after 2 months; at BAEKEN we always invest in development. Knowledge sessions are held regularly, and advanced modules are offered after some practical experience. This ensures a smooth transition from theory to practice and provides a safe and continuously evolving environment in which to learn and grow.

Conclusion

The BAEKEN training program is more than just training; it is an investment in the future of project management and an ongiong commitment to professional growth. Through a holistic approach to technical, analytical, and social skills, the program prepares individuals to make an impactful contribution to complex projects. With the support of experienced professionals, a focus on continuous growth, and a culture of continuous knowledge sharing and development, the Baeken training program is the ideal springboard for anyone who aspires to a career in project management.

You can build on foundations

Would you like to know more about our training?

Contact

What is your next step?

We are happy to think along with you

all vacancies

Project Controls Consultant

Junior Project Controls Consultant

all vacancies

Work Breakdown structure (WBS), key to success?

The Work Breakdown Structure and WBS Dictionary

One of the pillars of every project is the Work Breakdown Structure (WBS) and the associated WBS dictionary. Whether you are a contractor presenting the project baseline or the client reviewing it, the WBS and WBS Dictionary are your Rosetta Stone for understanding how the different pieces of a project will ultimately come together.

What is the WBS?

The WBS is the hierarchical subdivision of the project based on deliverables. It is the actual structure that we are used to seeing and using to organize the project. It allows us to break down the scope into manageable pieces and provides a reporting structure that we use for planning, performance monitoring, and actual costs.

The WBS Dictionary

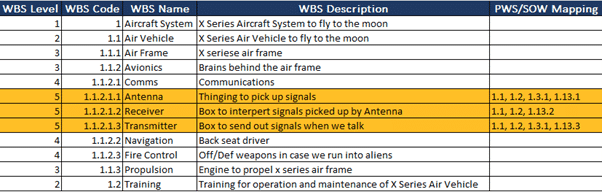
Figure 1. An example of a WBS Dictionary.

The WBS Dictionary, in addition to expanding the simple description of the WBS elements, links the WBS to the Statement of Work (SOW). The WBS dictionary is usually a spreadsheet that lists the WBS, the WBS element name, and a description of the work in that element. A good dictionary will also have a field indicating which SOW paragraph is covered by that WBS element.

The link between WBS and SOW

The last column in the example (Figure 1) shows how the lowest level elements of the WBS are related to the SOW. In the example, you can see that each element is related to two different sections in the SOW. This link demonstrates that the project will plan, execute, and capture actual project management costs with each individual element.

What does this linkage provide?

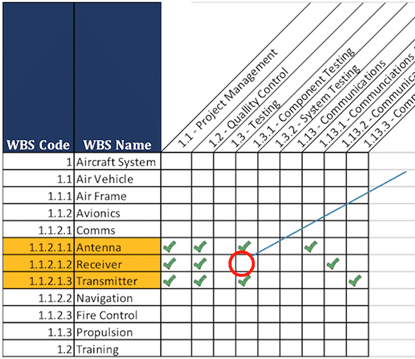
Linking these two structures allows you to view your project in different dimensions, which provides many reporting and analysis opportunities. It can quickly tell you whether you have everything covered in the SOW or are doing work in a WBS element that is not covered by the contract.

But that’s just the beginning. By looking at the relationships that exist between WBS elements in the schedule, you can see how different SOW paragraphs are linked and whether or not that makes sense. In addition, performance and actual costs can be assigned to SOW paragraphs. The visibility of this is even more valuable.

Conclusion

Used properly, the WBS dictionary becomes much more than a document describing work. It becomes a project kaleidoscope that allows you to view your project data in an infinite number of ways.

Understanding the WBS and the WBS Dictionary is essential to successfully managing a project. It provides a clear overview and in-depth understanding of how each part of the project comes together. It is a tool that should not be overlooked by project managers and stakeholders.

BAEKEN is ready for a solution that works for you!

Want to know more about WBS?

More info

Risk management involves more than most people think

In the world of project management, risk is often overlooked or simplified. But at BAEKEN, we know that it is much more than an afterthought. It is a crucial part of any successful project.


An integrated approach

With every project comes risk, and that requires risk management. This is not just a task for the project manager, but for the entire team. It includes identifying, analyzing, and evaluating the risk and its potential impact.

Mitigation Plan

A risk mitigation plan is not just a reactive document; it is a proactive approach to mitigating potential damage. At BAEKEN, we define risk events as those that could have a negative or positive impact on the project.

Identification process

Risk identification is a layered and dynamic process. It involves not only identifying potential problems, but also creative and organized thinking. This includes brainstorming all possible risks that could negatively or positively impact the project.

Detailed Process

Risks do not materialize in a vacuum; they can be tracked, understood, and evaluated. Checklists, based on previous experience, are a core part of the BAEKEN methodology and a valuable tool in identifying potential risks.

Risk Assessment

Risks are not all the same, and at BAEKEN we categorize them into areas such as technical, human, financial, and more so that we can thoroughly evaluate and manage them.

Monte Carlo Simulation

This statistical method goes beyond superficial calculations; it provides an in-depth simulation of possible outcomes and helps the BAEKEN team make accurate projections of risk events.

Risk Mitigation

At BAEKEN, risk mitigation is not a standard practice; it is a customized strategy that considers various factors such as risk avoidance, risk sharing, and more.

Contingency Plan

We believe in flexibility and preparation. Our contingency plans are not mere back-ups but essential components for achieving project goals, even in the face of unanticipated risks.

Risk management at BAEKEN is more than a process; it is a philosophy. We are aware of its complexity and versatility. With our comprehensive approach and commitment to quality, we are a reliable partner for successful project control.

BAEKEN is ready with a solution that works for you!

Do you have an overview of all the risks?

More info