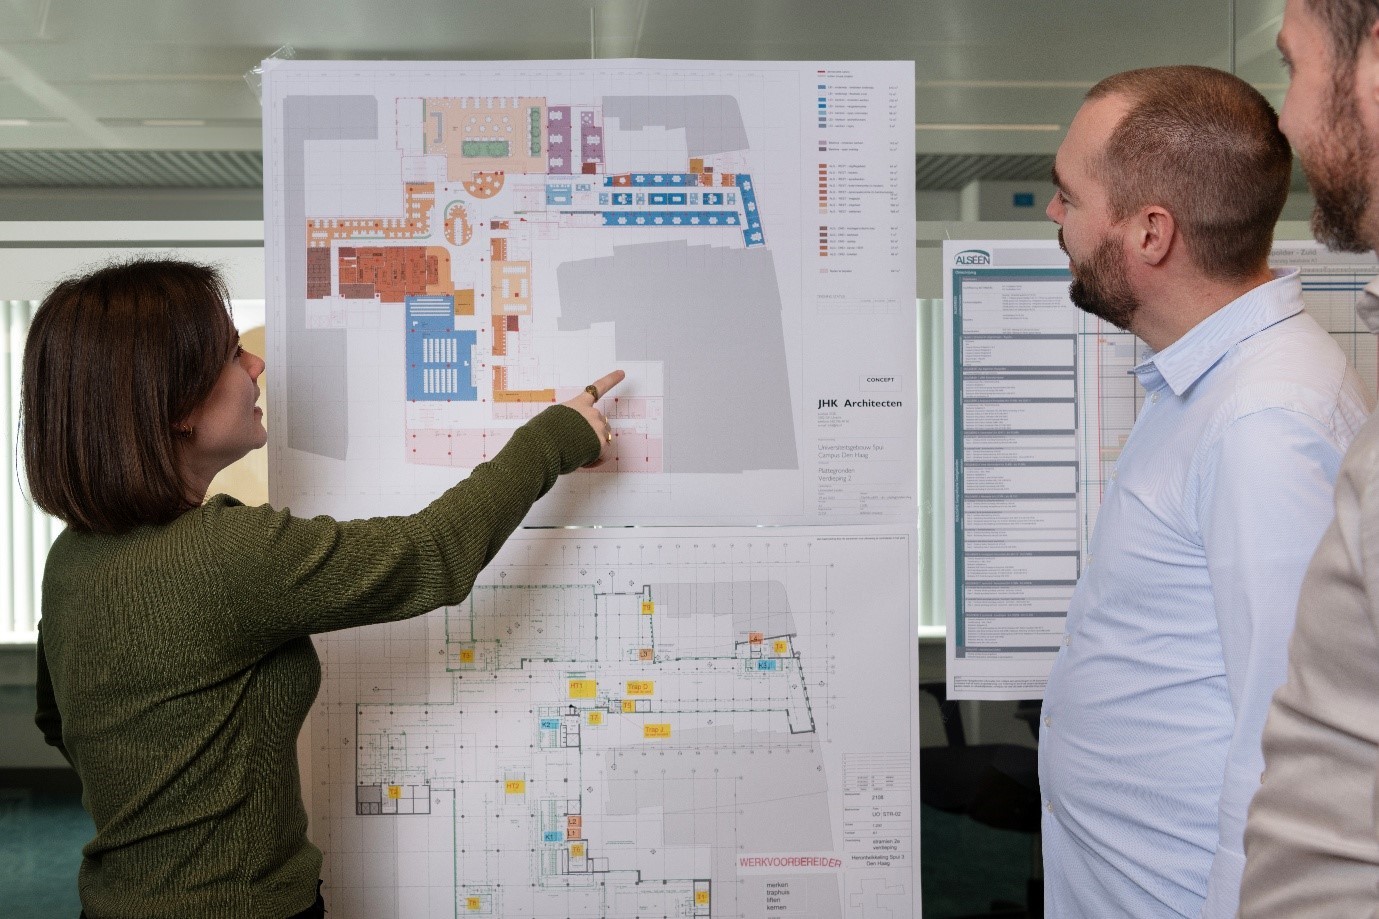
My work is to spot what’s required, listen to how teams actually work, and design tools to effectively support the team’s goal. A tool is only as good as the conversation it unlocks, so I ensure both. The guiding question is: “Which conversations must this tool prompt to bring clarity ahead of the deadline?” By the end of this article, I will have shown you how I help project teams by: (1) show where work is (not) happening, (2) provide concise overviews, (3) support defining priorities, and (4) advise a clear course of action they can take steps on right away.
At BAEKEN, we strive to develop and use the most effective tools. Sometimes that’s as simple as post-its on a wall, a quick Excel sheet, or a flowchart. Other times, it’s the most advanced analytical tools – calculating progress on 20.000 activities or running a quantified risk analysis. The point is: the tool supports the work, it should not be the work.
We implement tools according to our core values: Diligent, Analytical, Forward-looking, and Social. Our values Diligent and Analytical can be seen clearly in Paul’s article . While we embed all our values in our work, this article focusses more on how I implement Forward-looking and Social aspects of effective tooling.
Working with clients, we improved the visibility on deliverable and decision timelines. Small, focused tools changed the effectiveness of weekly meetings:
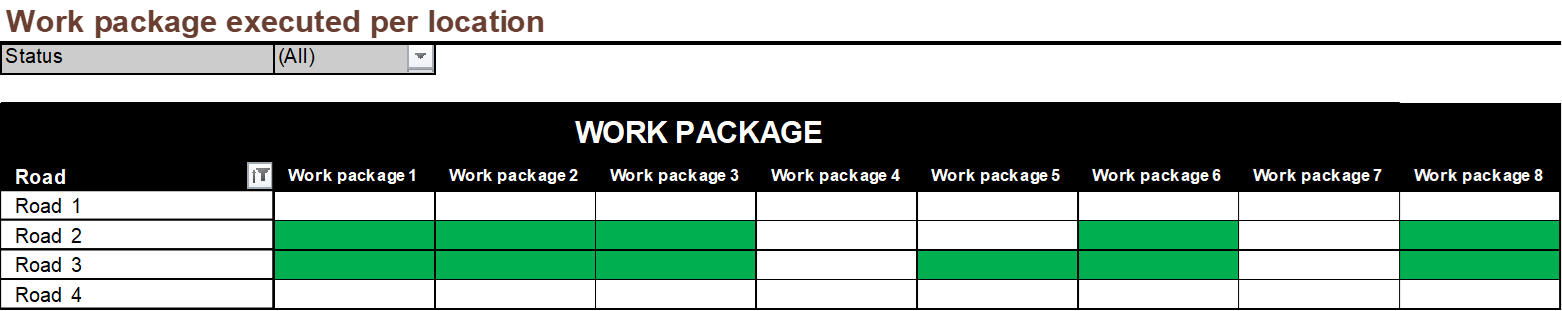
1. Location-based coverage: Maintenance matrix for roads. A simple matrix made visible where maintenance activities were actually executed, so the Technical Manager could verify coverage and spot gaps immediately. A straightforward PivotTable was sufficient for this product: it was easy to set up, and most importantly, quick to update. I automated part of this work by getting data from the PDF planning and cleaning it up with Power Query.
I spotted the need for a better insight in this information, drew out the data we had on a piece of paper, selected the quickest way to the goal: Power Query and Excel, build the Power Query and simply started using it in the meetings. It was a success.
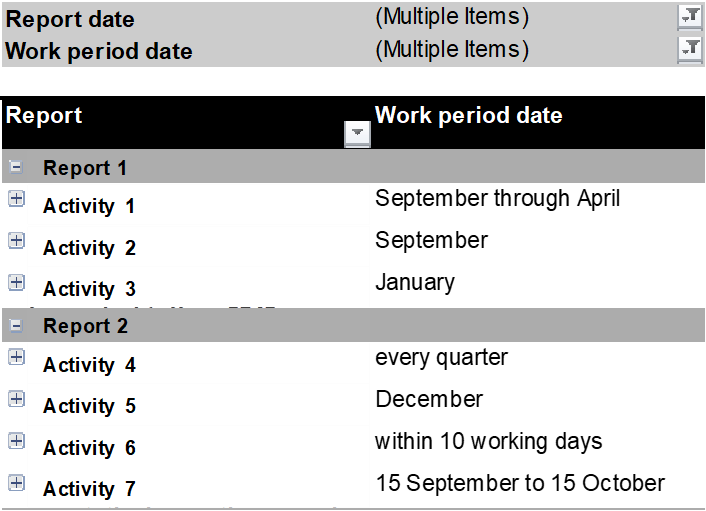
2. Concise overviews: Report dashboard for the Technical Manager. In this case we are talking about project reports and expectation management. It’s very hard to plan resources and feed back plausible completion times when you don’t have a clear insight into when your input data will come in. We needed a clear overview of what report to expect when and what high level the content would be. So, I made a dashboard once more using Power Query and PivotTables showing which reports were expected in the current period and what was coming next. Evaluating the contractor’s reports therefore became smoother with fewer surprises.
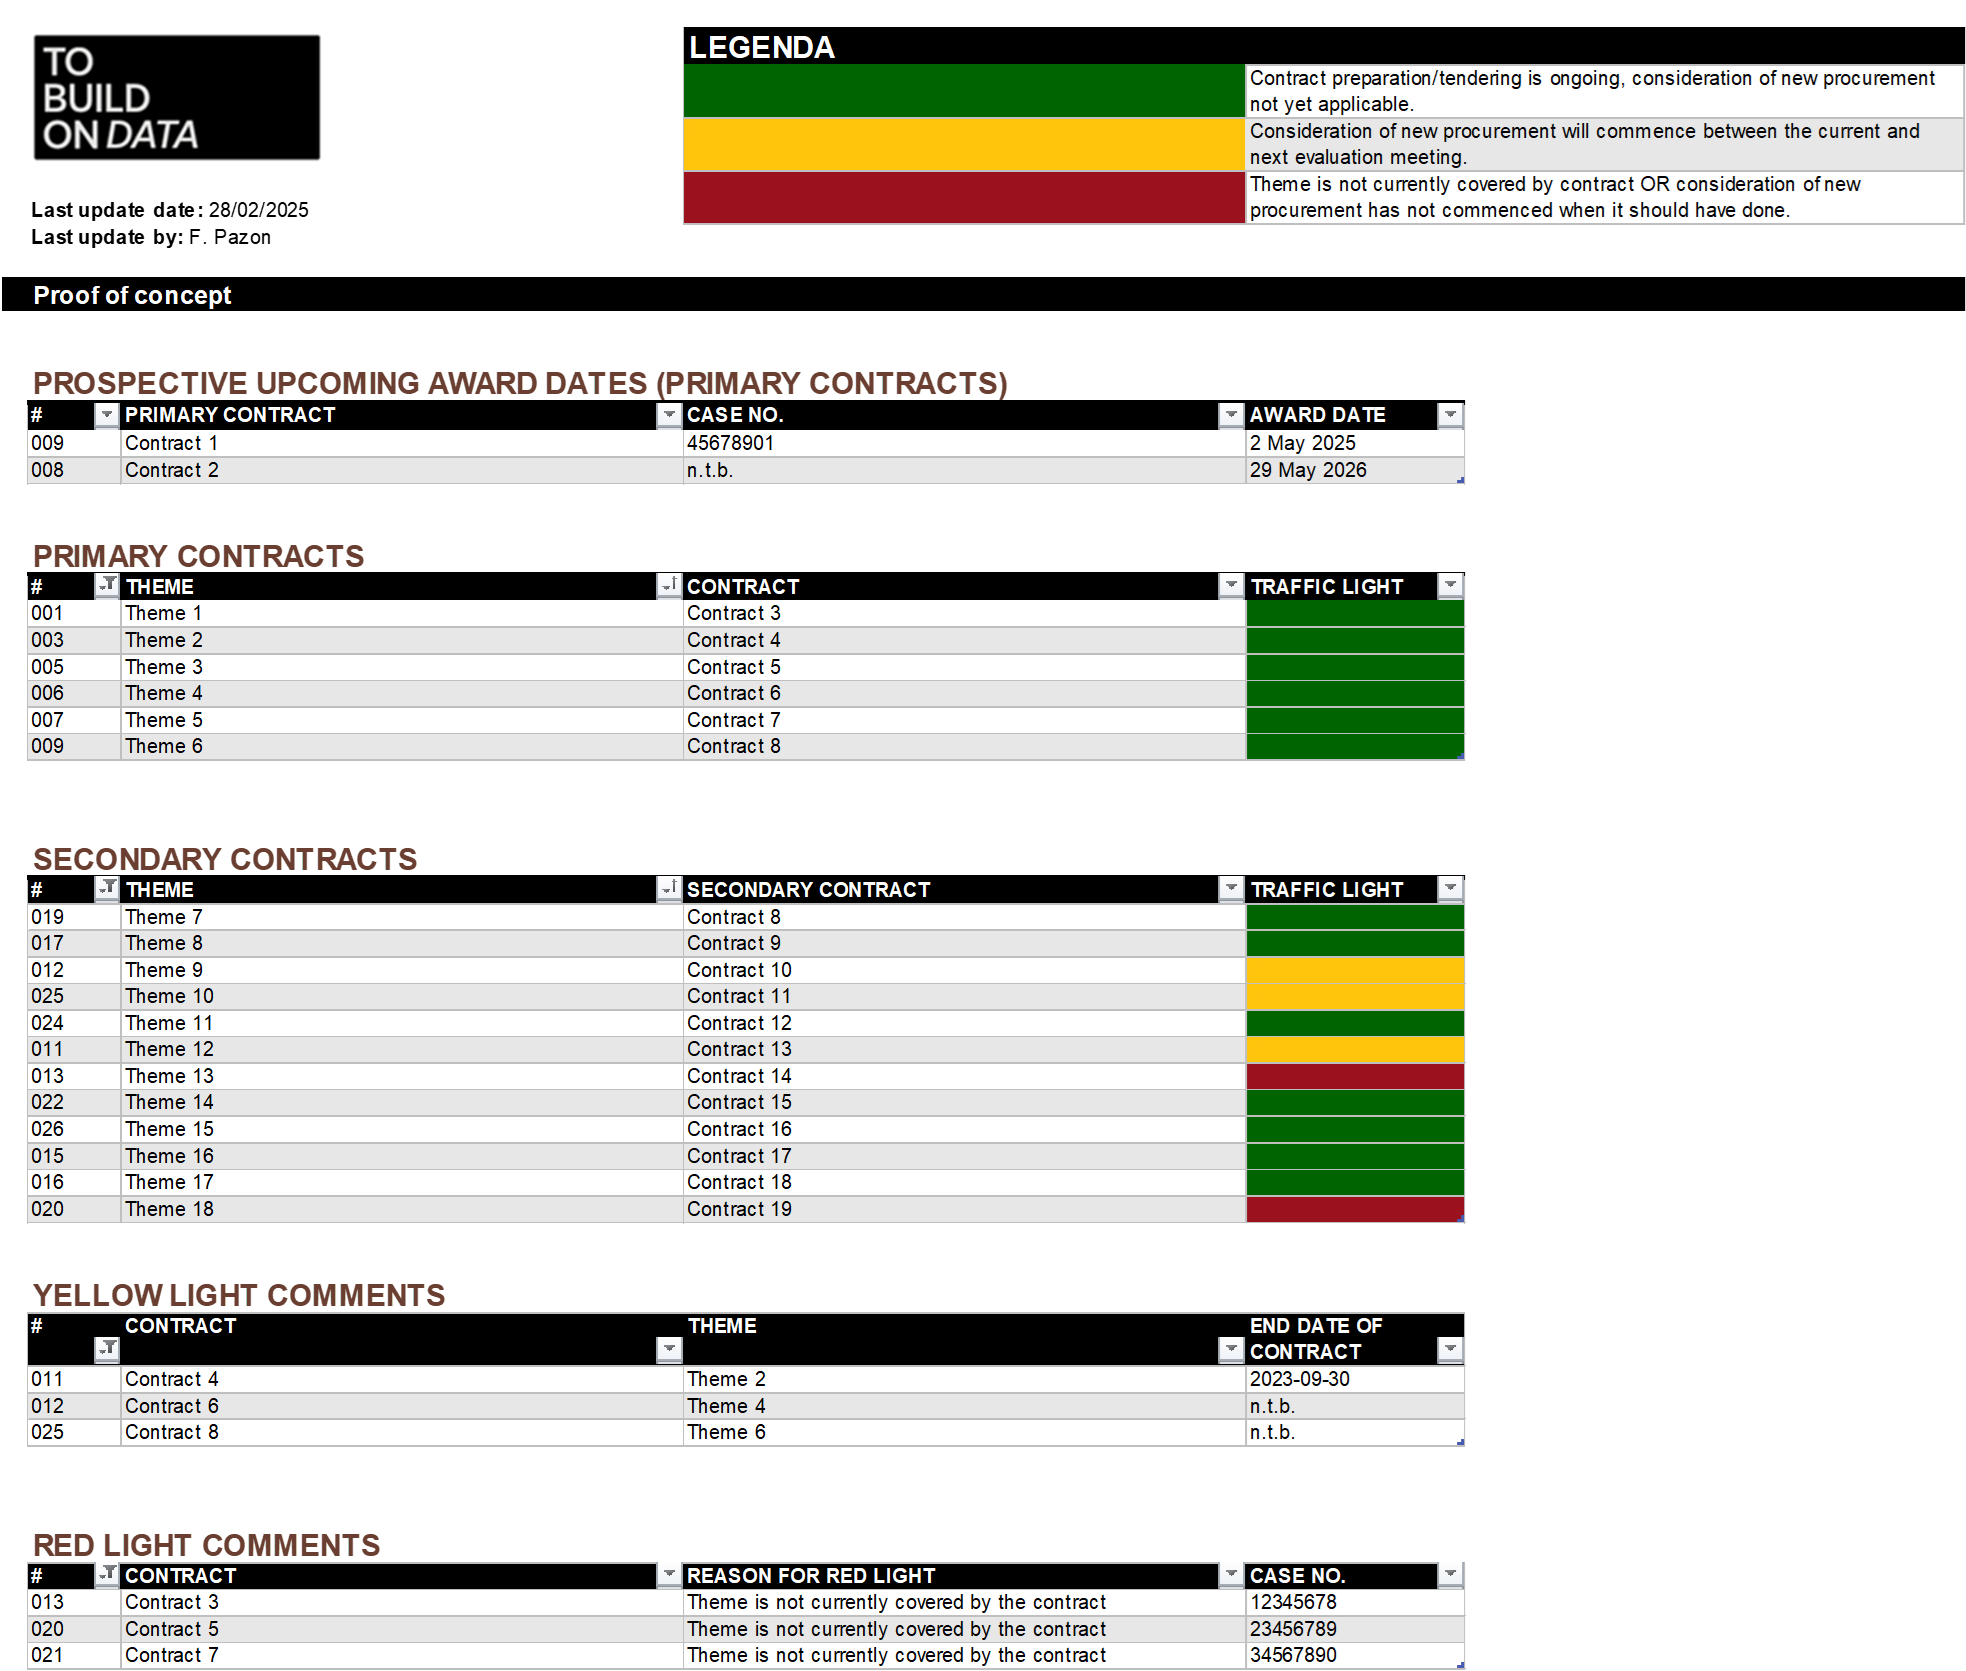
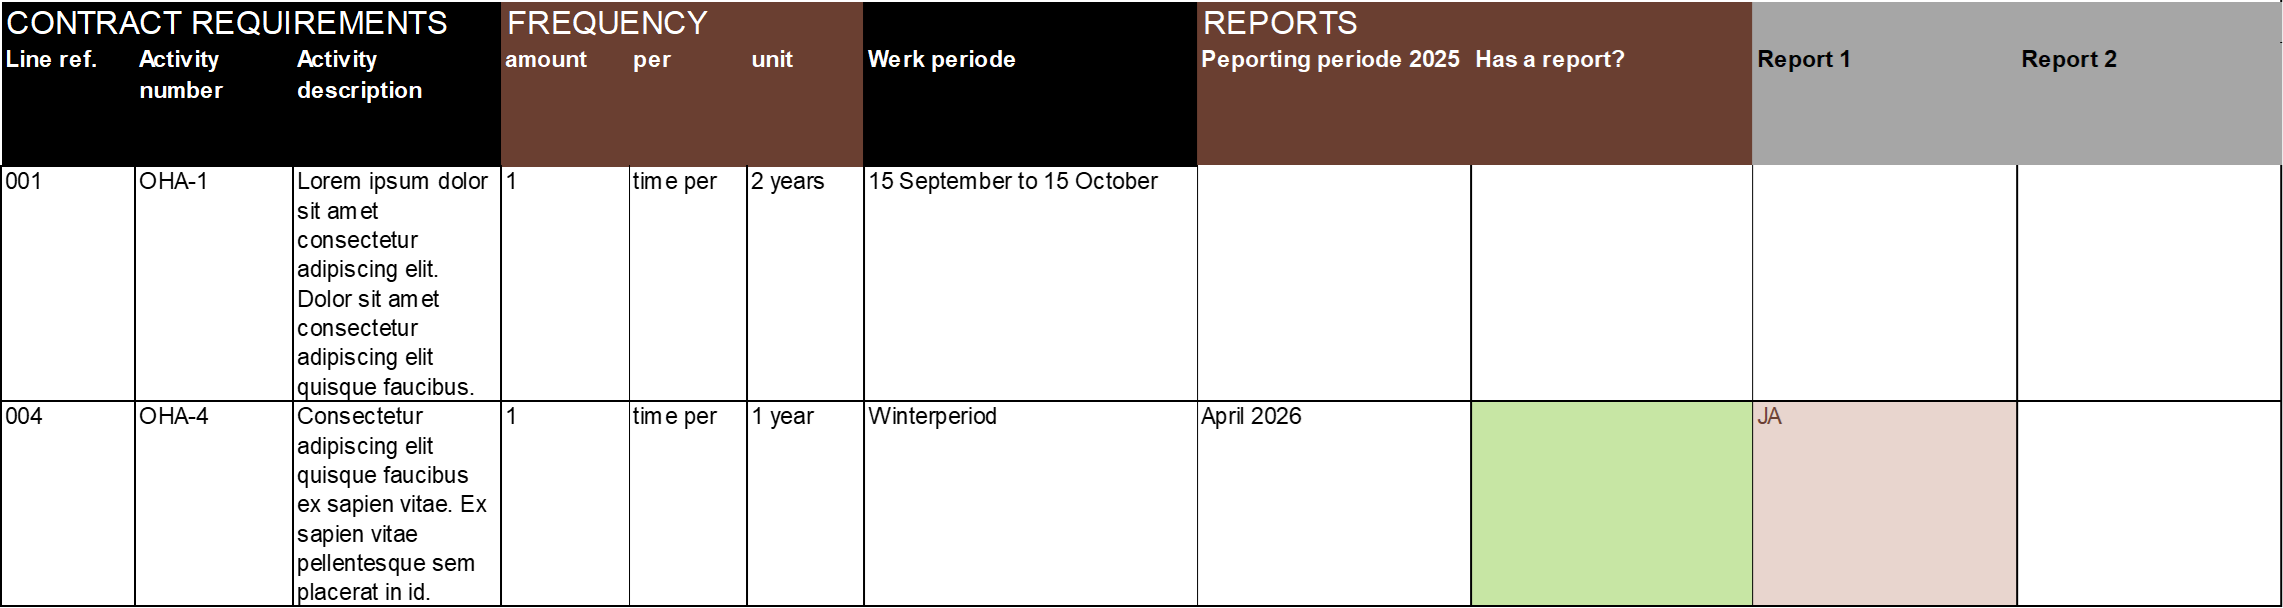
3. Clear priorities: Contract status at a glance. The team works on multiple contracts which are in different stages. The team needs a quick overview showing where decisions are needed during meetings. For this, I made a traffic-light overview with the right-most column giving a clear red/yellow/green status and short notes on why. This is so they only need to focus where attention is currently needed, and meetings are more effective.
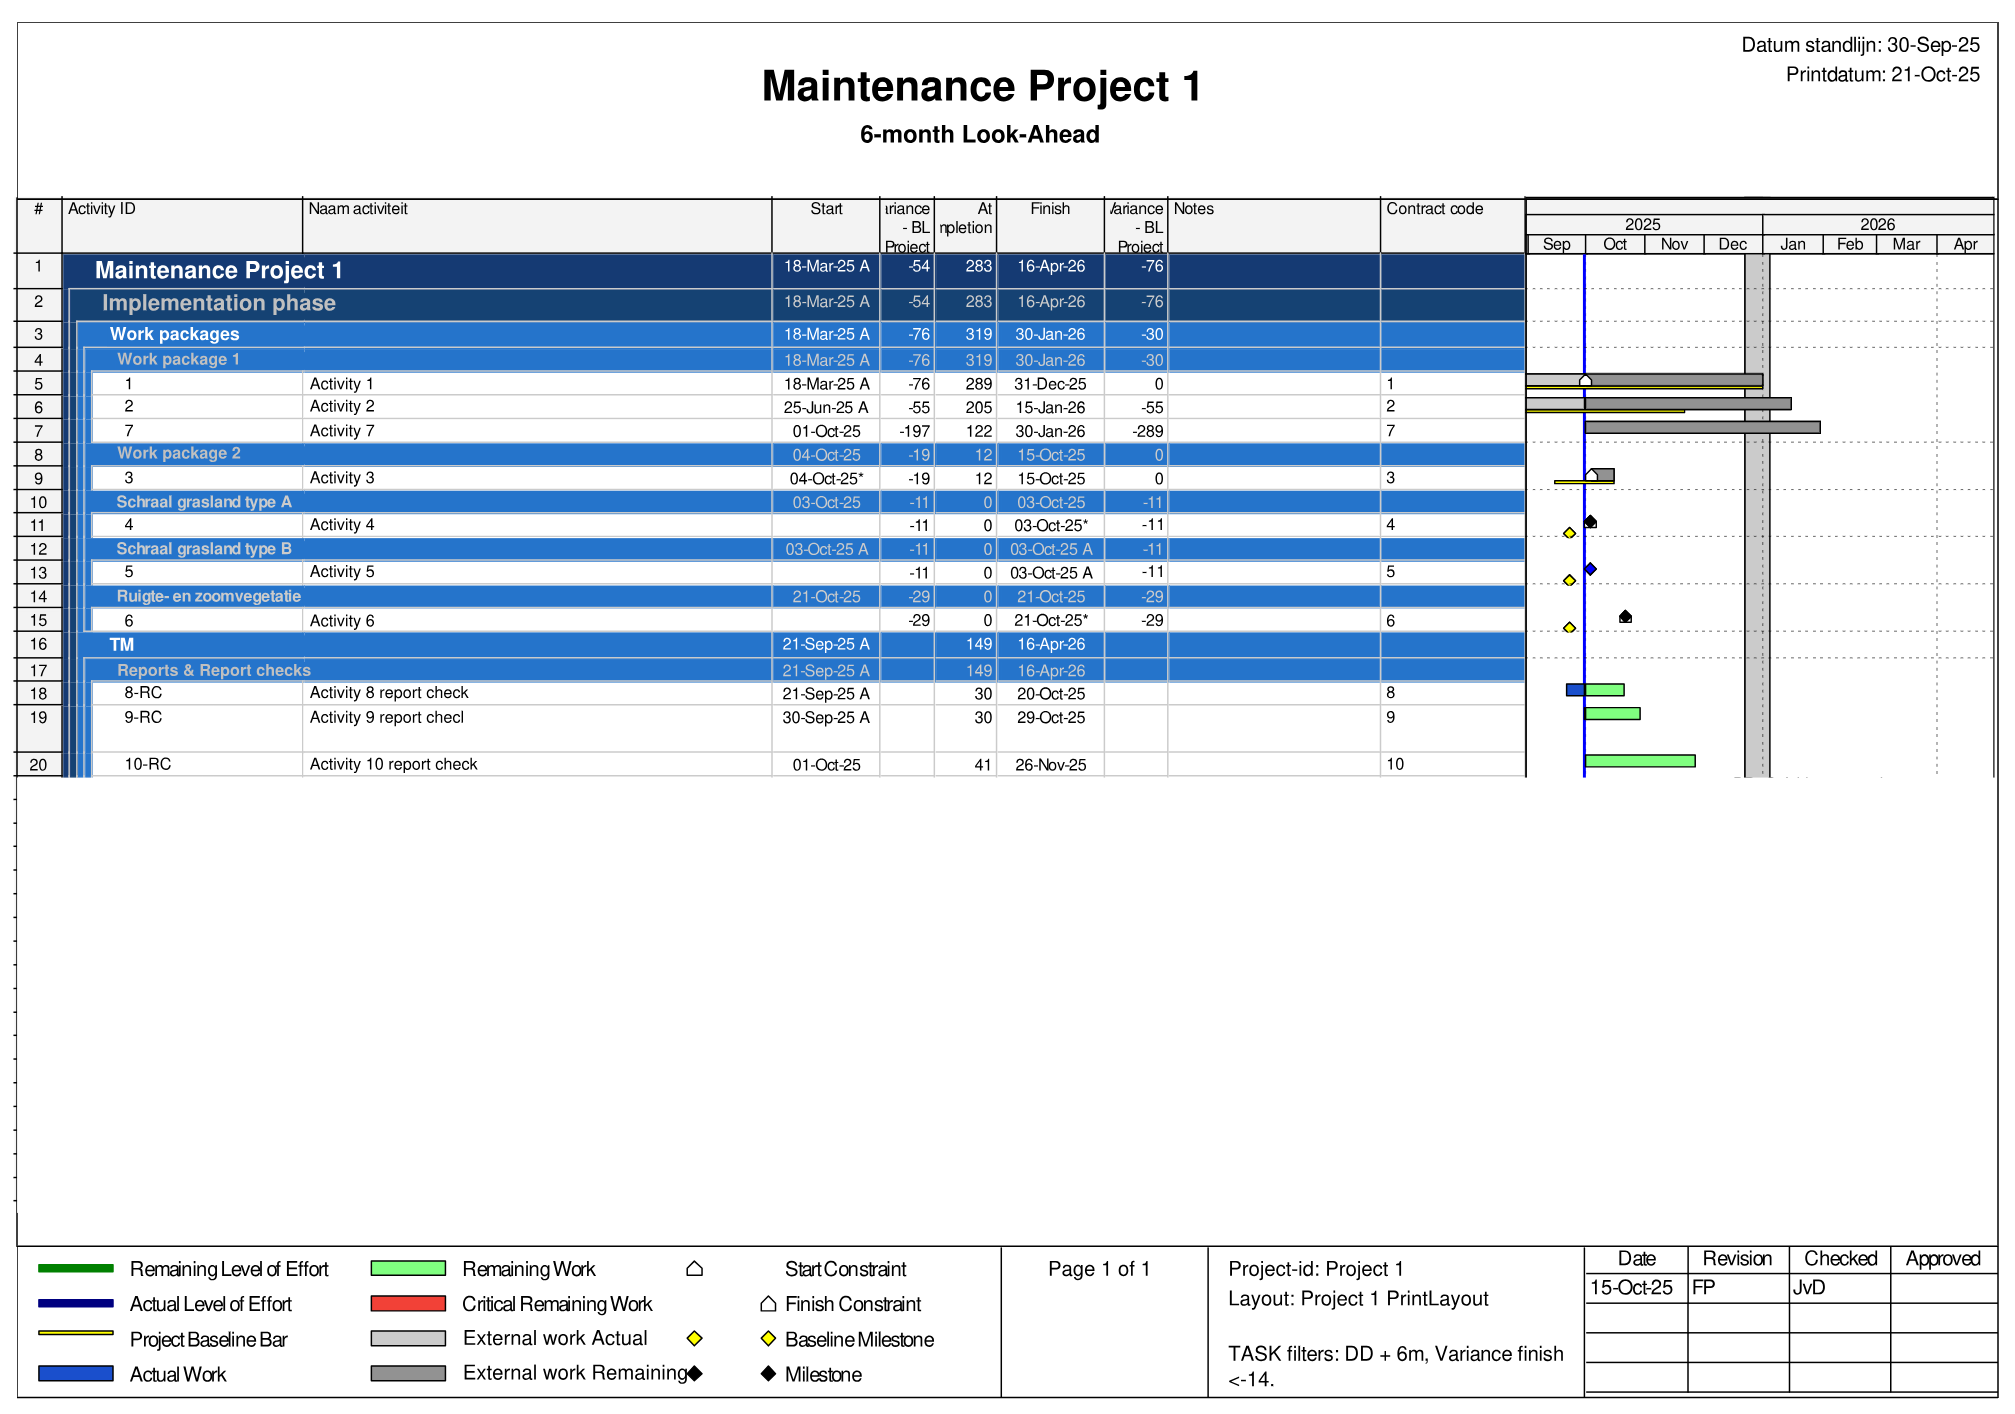
4. A clear course of action: baseline comparison. Clarity was required on the expected execution dates for maintenance. Particularly the difference between contract dates and current progress updates needed to be clear. Activities of the contract requirements that the Contractor must fulfil were not visible next to real progress in the schedule, therefore the Project Control Manager and Technical Manager had no comparison points. To begin, I started with making a table out of the contract requirements.
This allowed me to set up baselines for the project, so the contract dates and activities sat visibly beneath actuals. The Project Control Manager could steer on deviations (see the yellow bars and diamonds beneath the activity bars and milestone diamonds) instead of reacting late. It is also clear to the team that activities without a baseline have no contractual dates.
Want to see the broader context of the various work that BAEKEN offers? Read Jopie’s article .
People who listen first and keep the loop tight. Tools at BAEKEN are not the goal – the goal is better decisions, made together, on time. The focus is on understanding the work, the people, and the context first, and then selecting or building the most appropriate tool to serve that purpose, if it is necessary. Whether it’s a paper sketch, Excel model, or PowerBI dashboard, the goal is to create clarity, alignment, and actionable insight. That fits the way you actually work: where work is (not) happening is visible, overviews are to the point, priorities are clearer, and next steps are directly actionable.
Want to know more about this topic?